BlogGuide
Unit Economics Template: Free One-Page CAC, LTV and Payback
A free one-page unit economics template with the formulas for contribution margin, CAC, LTV, LTV to CAC and payback, and a worked example you can check by hand.

By MakeOnepagers Team
Updated · 7 min read

A unit economics template answers the question every investor, lender and founder eventually asks: do we make money on each customer, or do we lose a little more with every sale? Growth can hide the answer for a long time. Unit economics bring it into the open by looking at a single unit, usually one customer or one order, and comparing what it brings in over its life with what it cost to win. Below are the five numbers that make up unit economics, the formulas, a free unit economics template you can copy, a worked example you can check by hand and the mistakes that make the numbers look better than they are.
One‑Pager examples
Real One-Pagers made with MakeOnepagers. Open any one to edit it as your own.
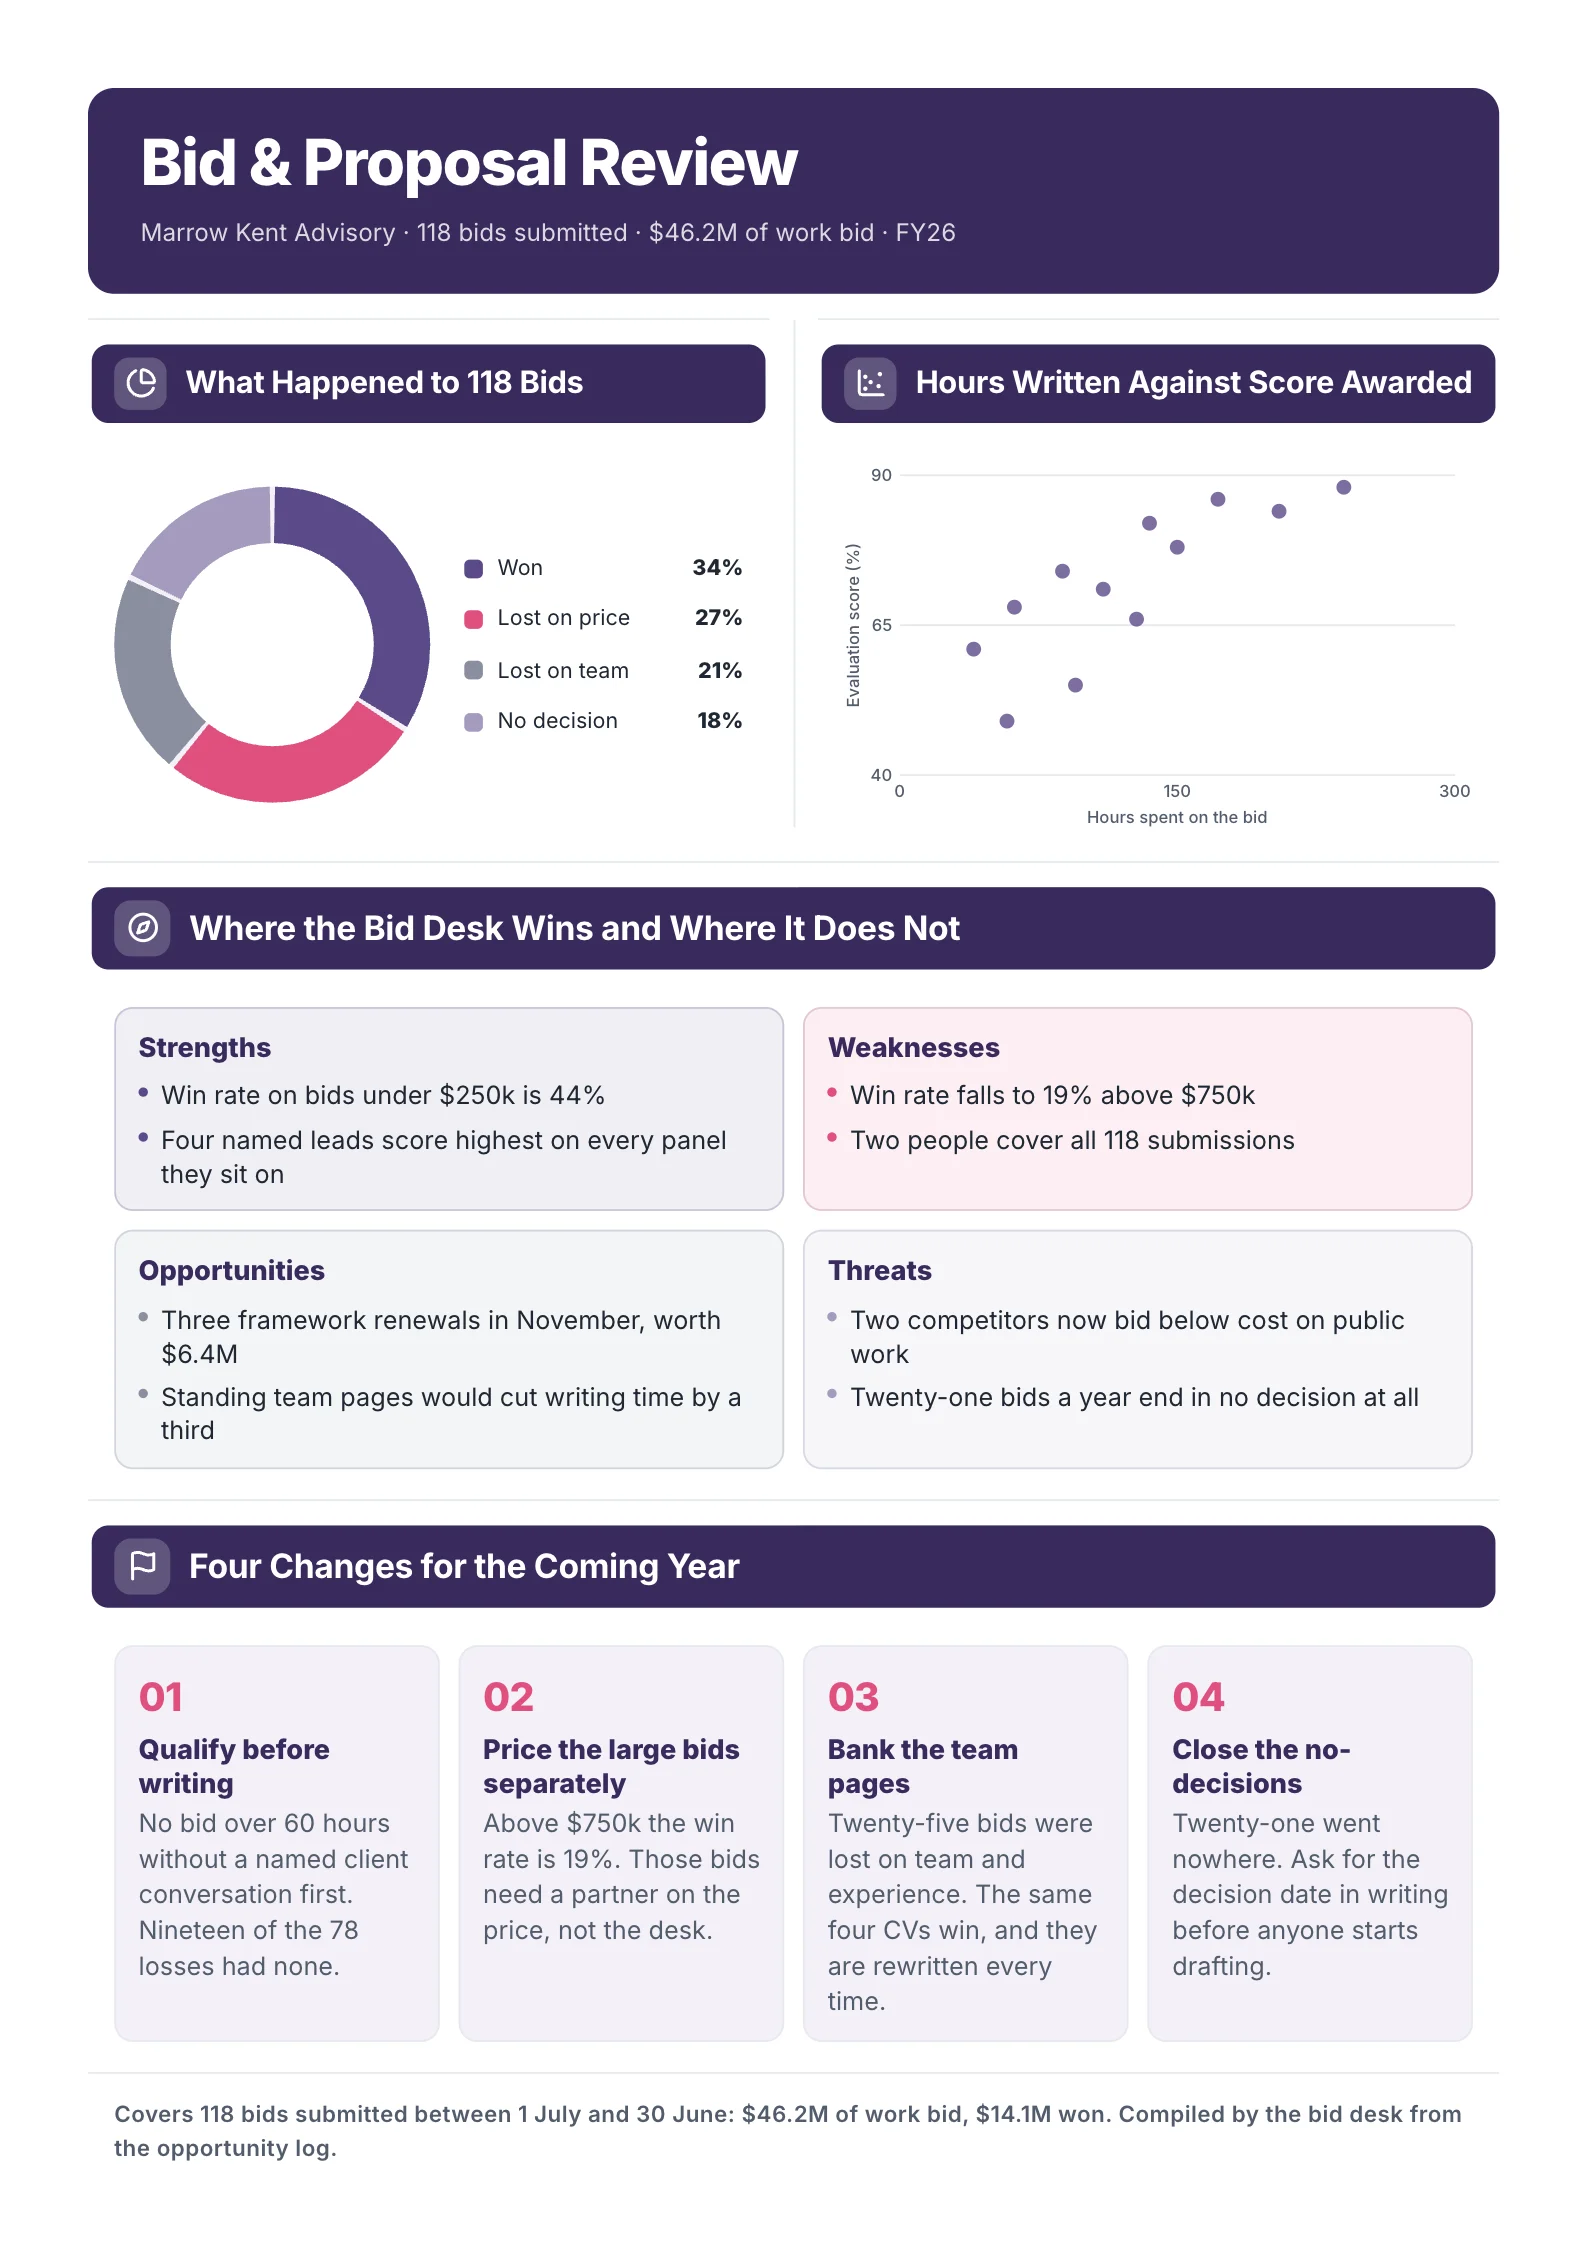
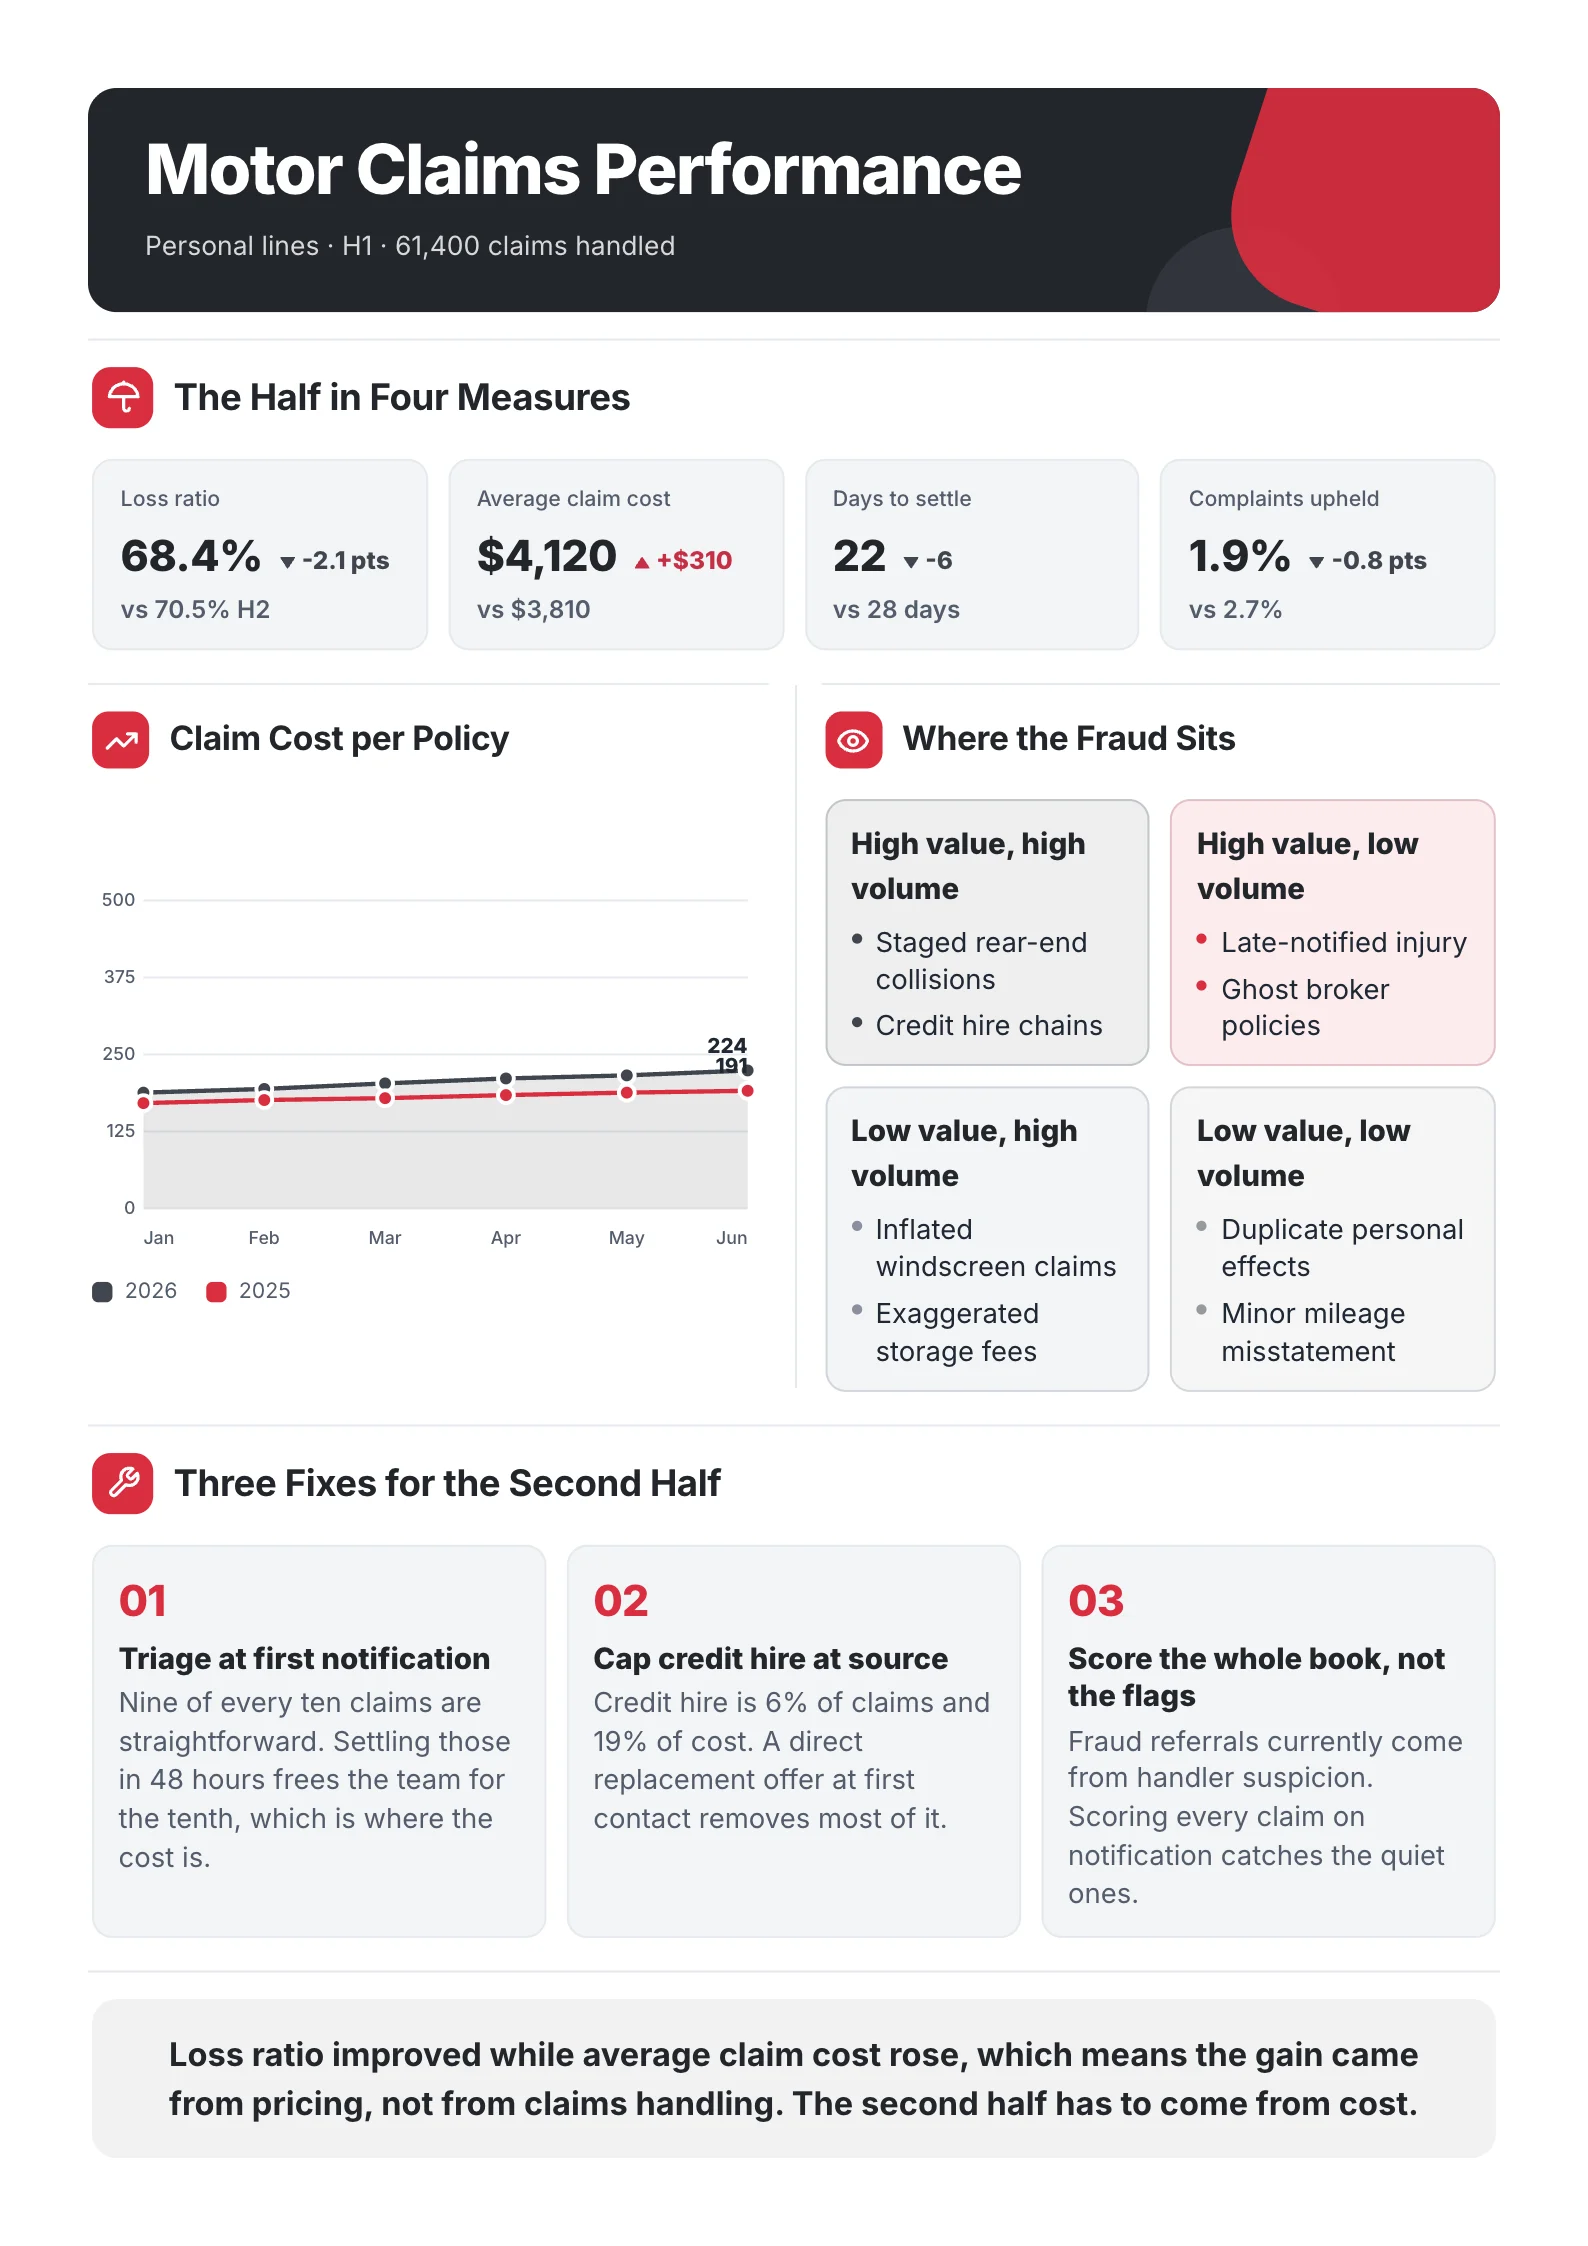
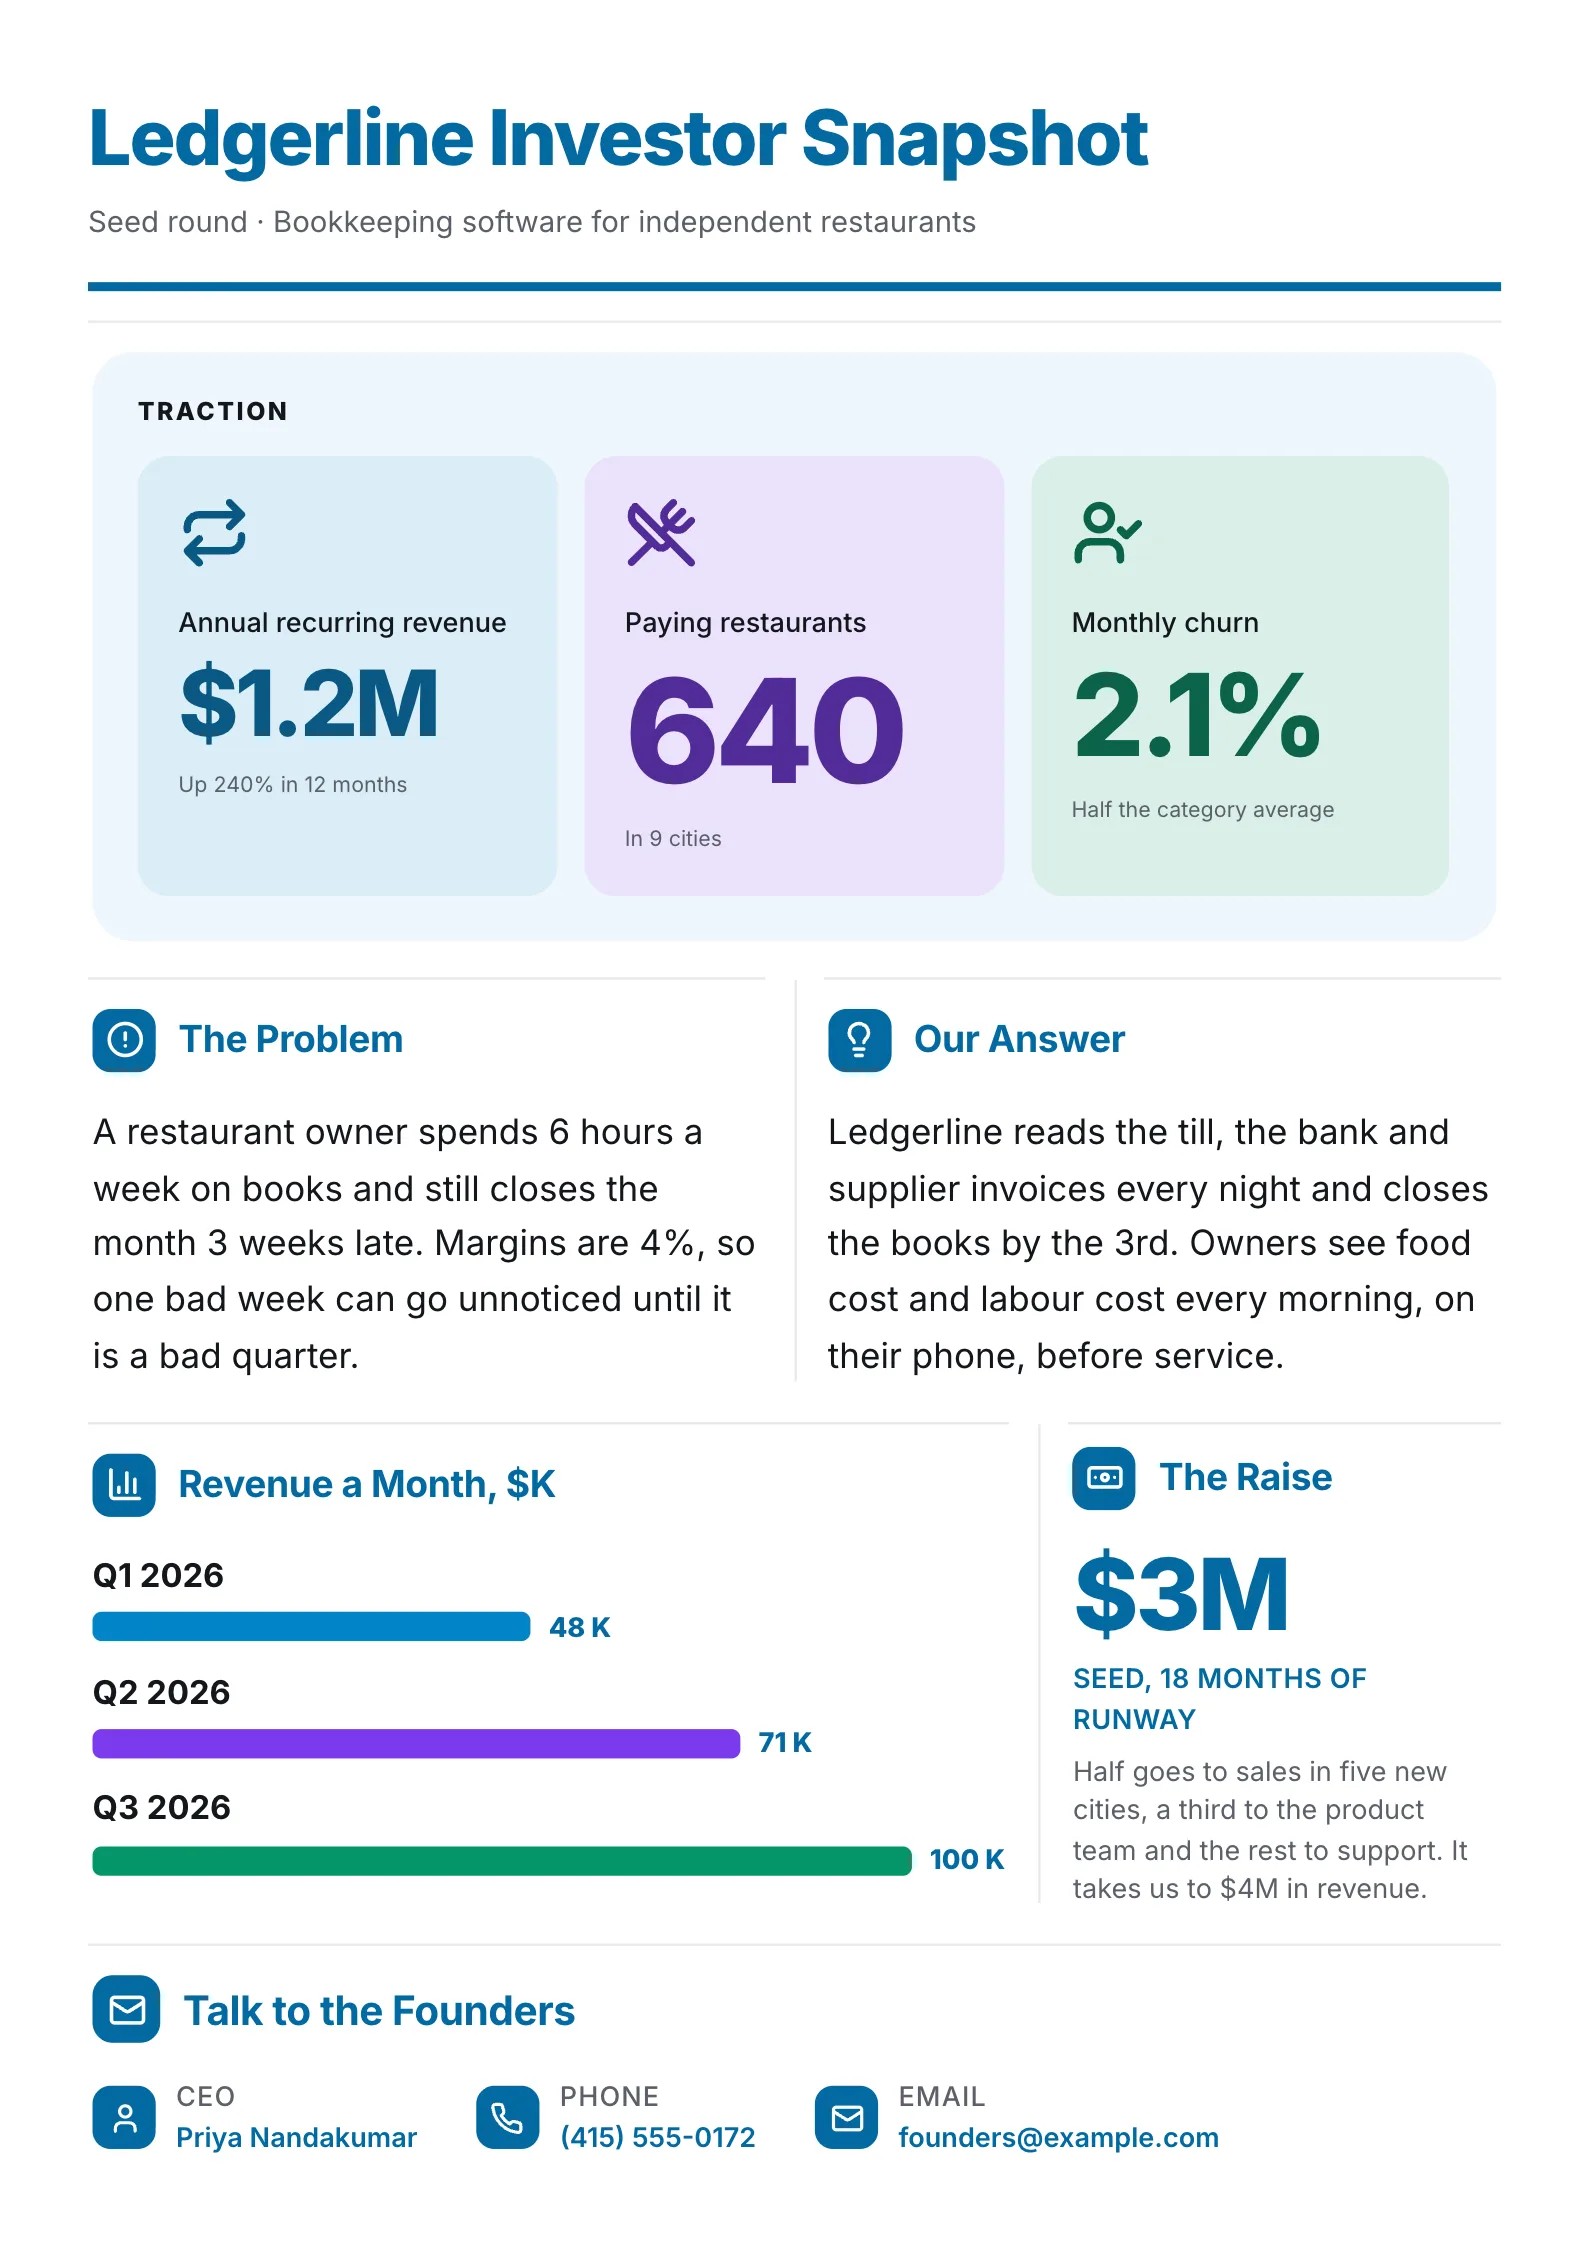 Investor SnapshotEdit for free(opens in a new tab)
 Investor Pitch One-PagerEdit for free(opens in a new tab)
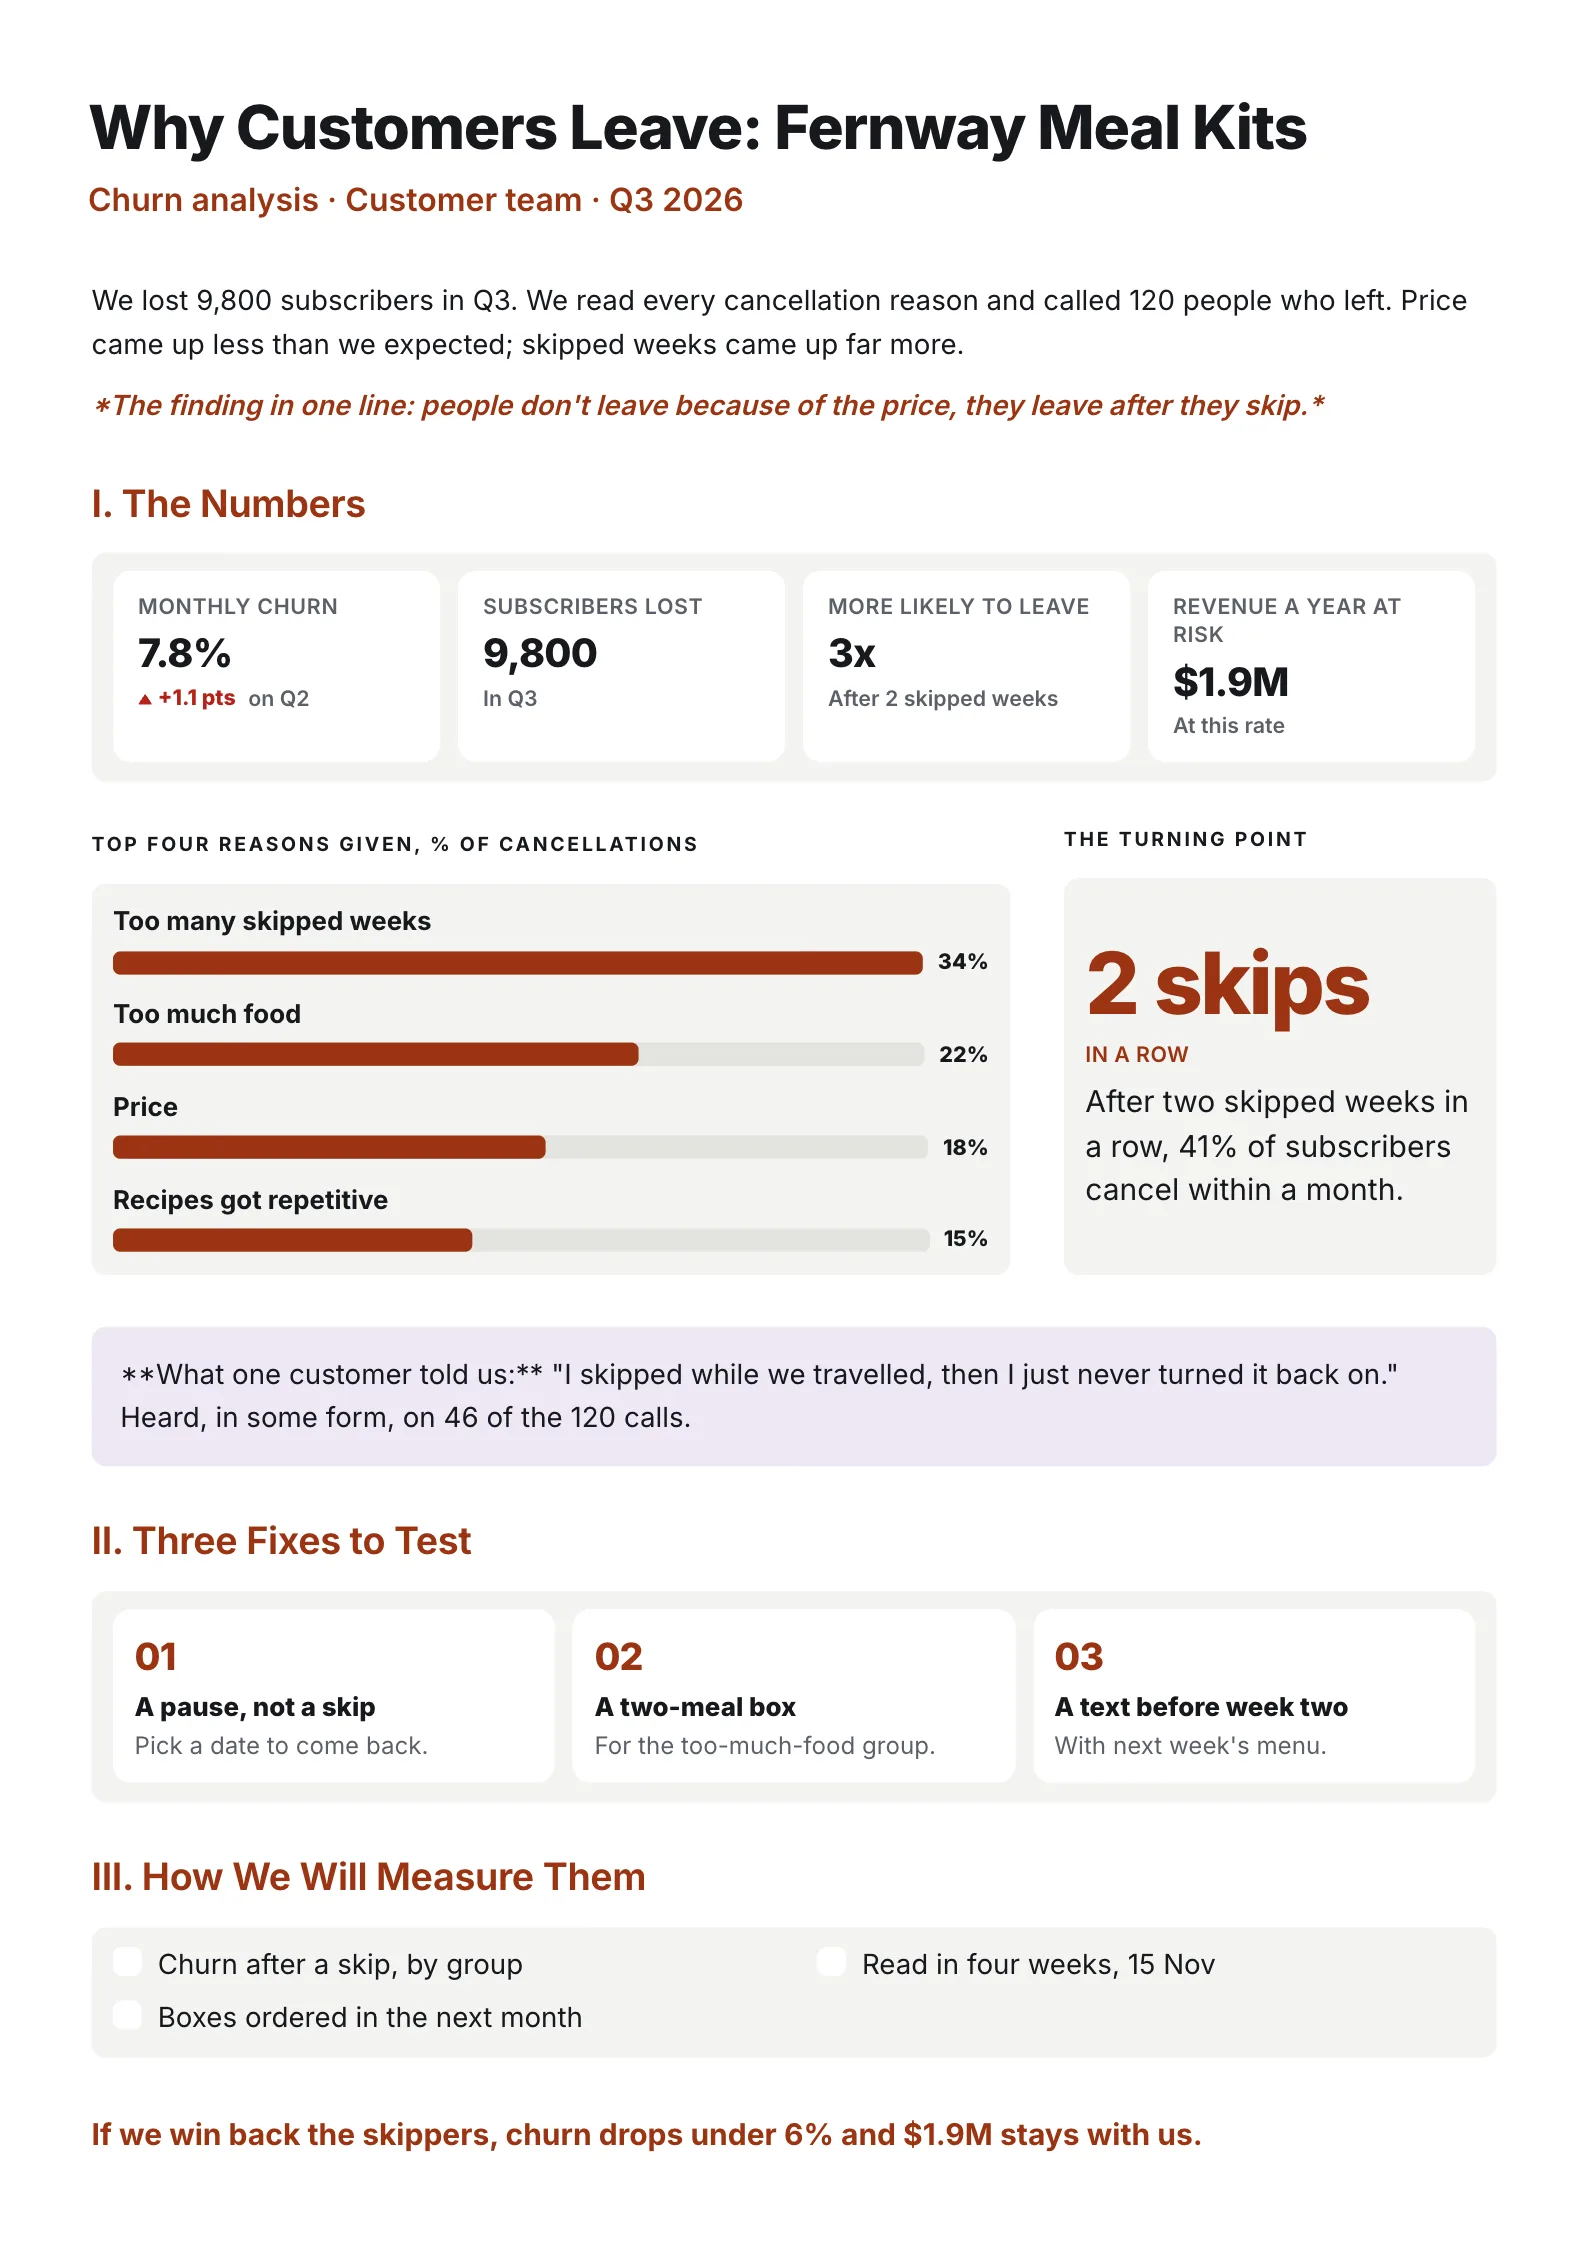 Customer Churn AnalysisEdit for free(opens in a new tab)
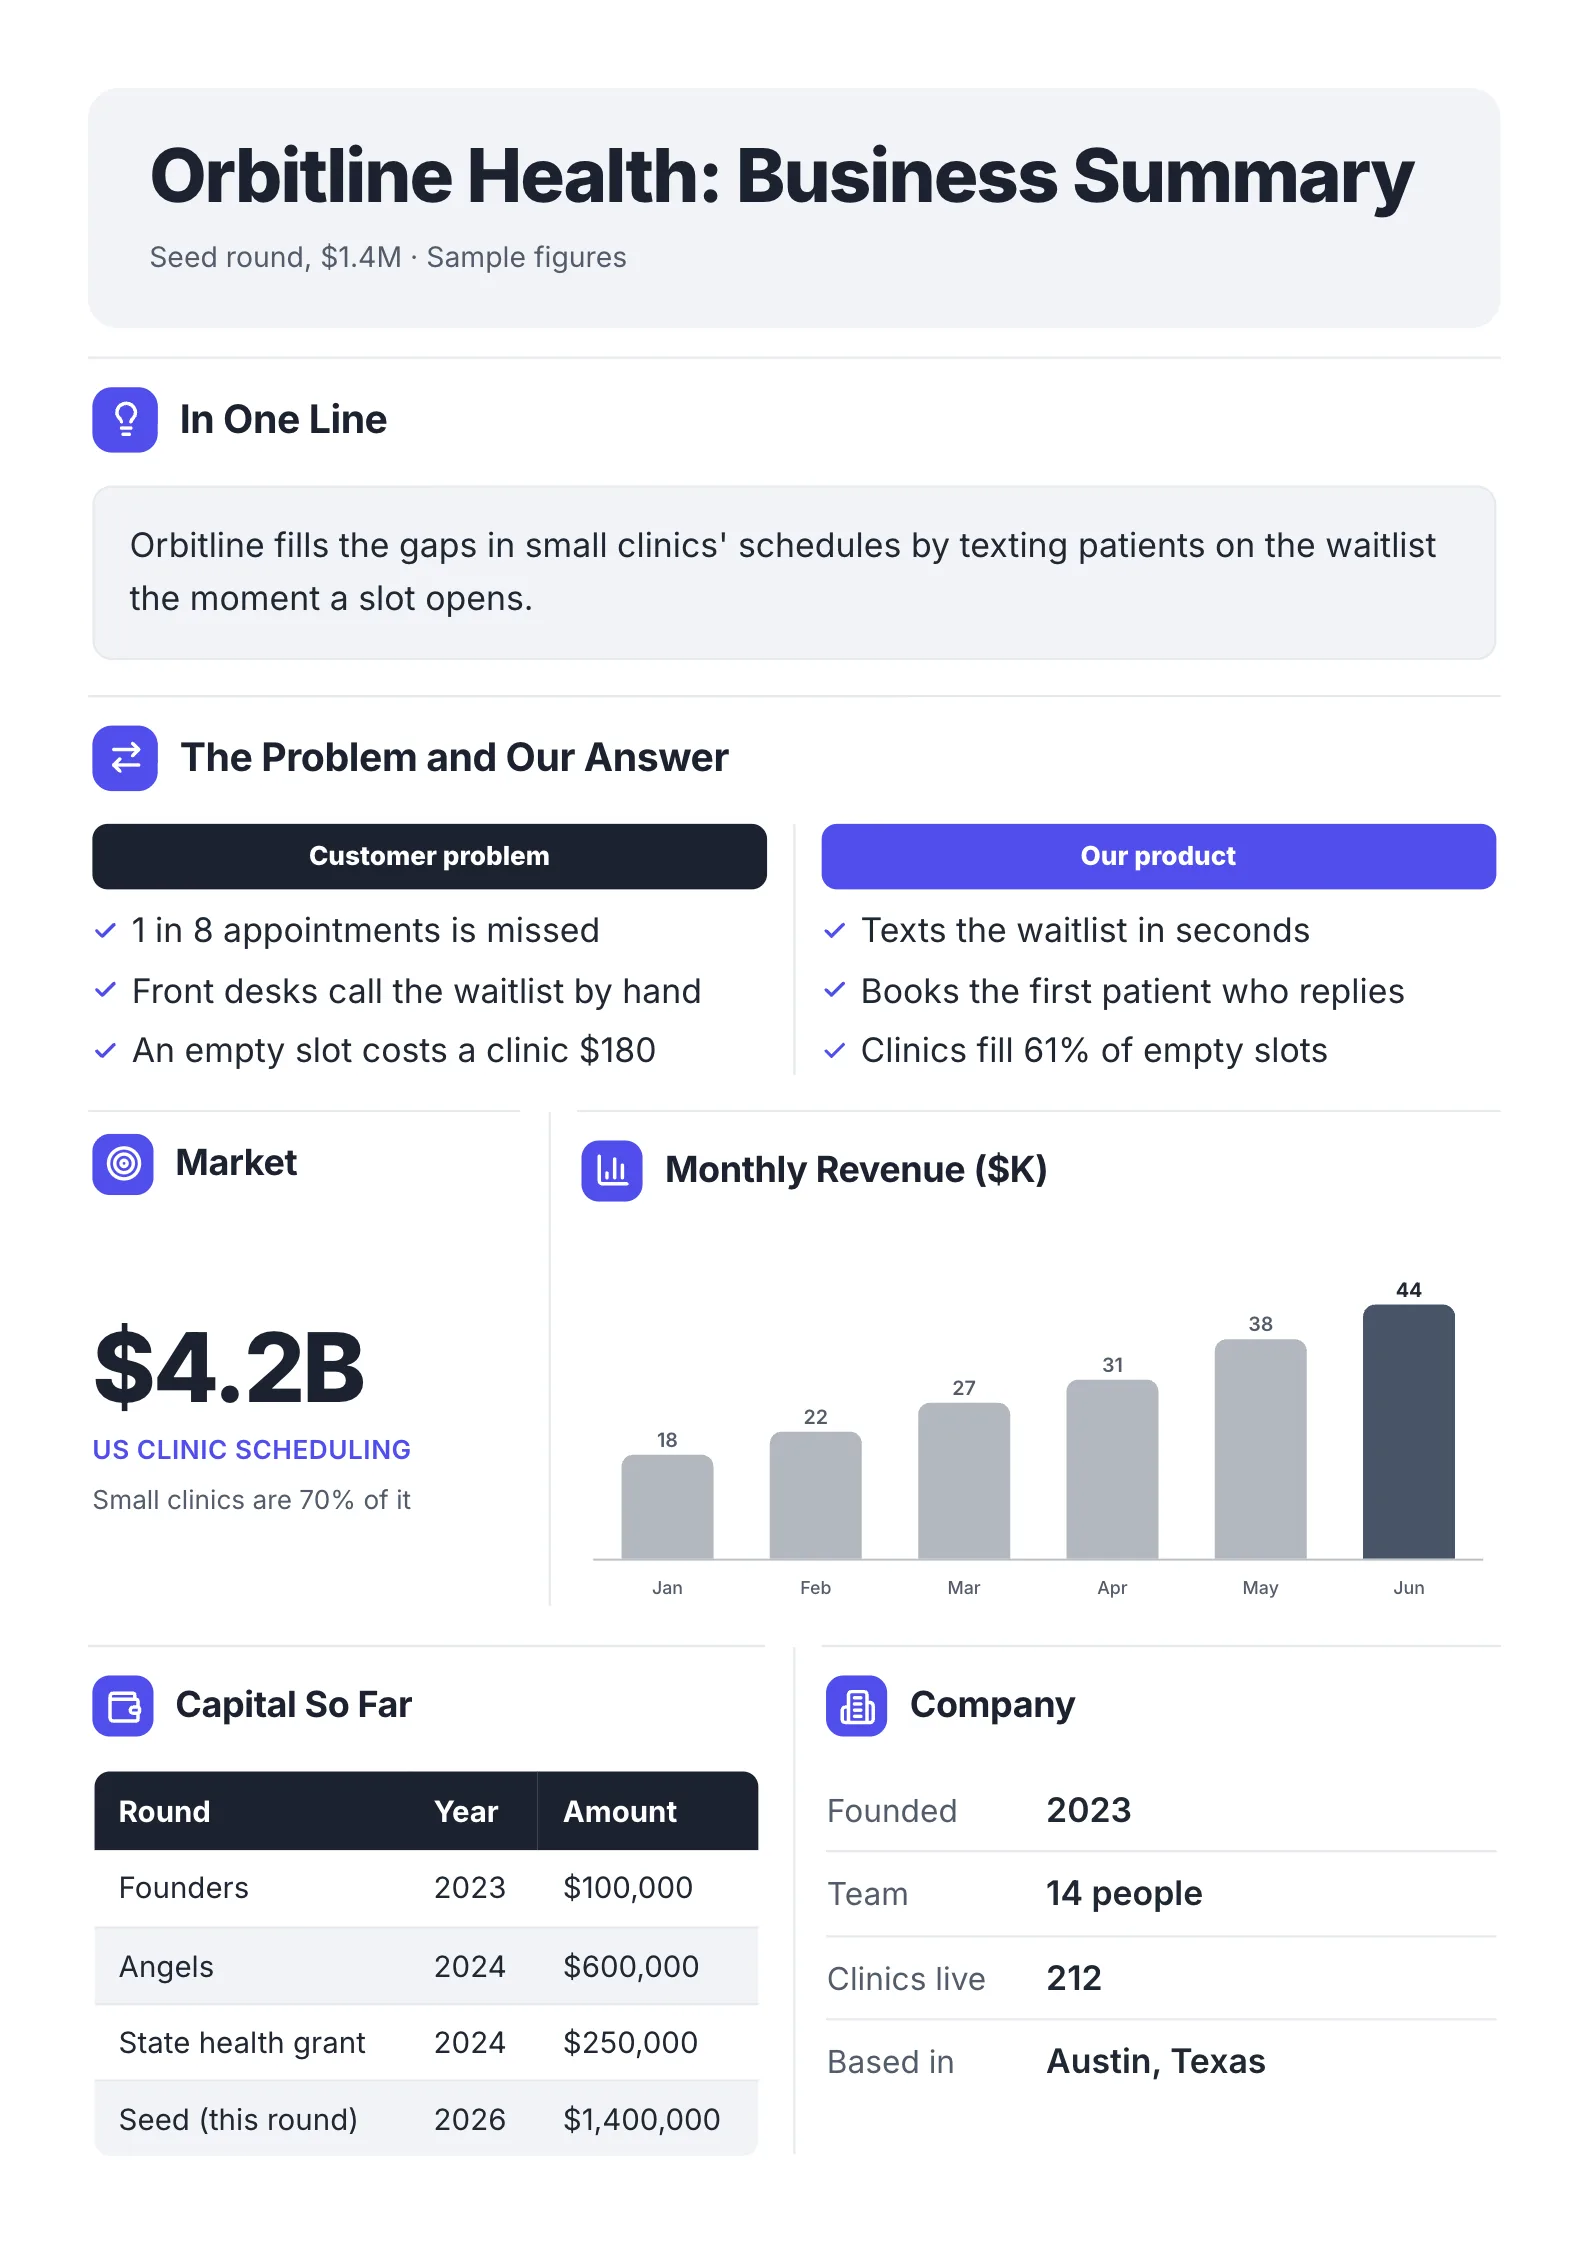 Business Summary for InvestorsEdit for free(opens in a new tab)
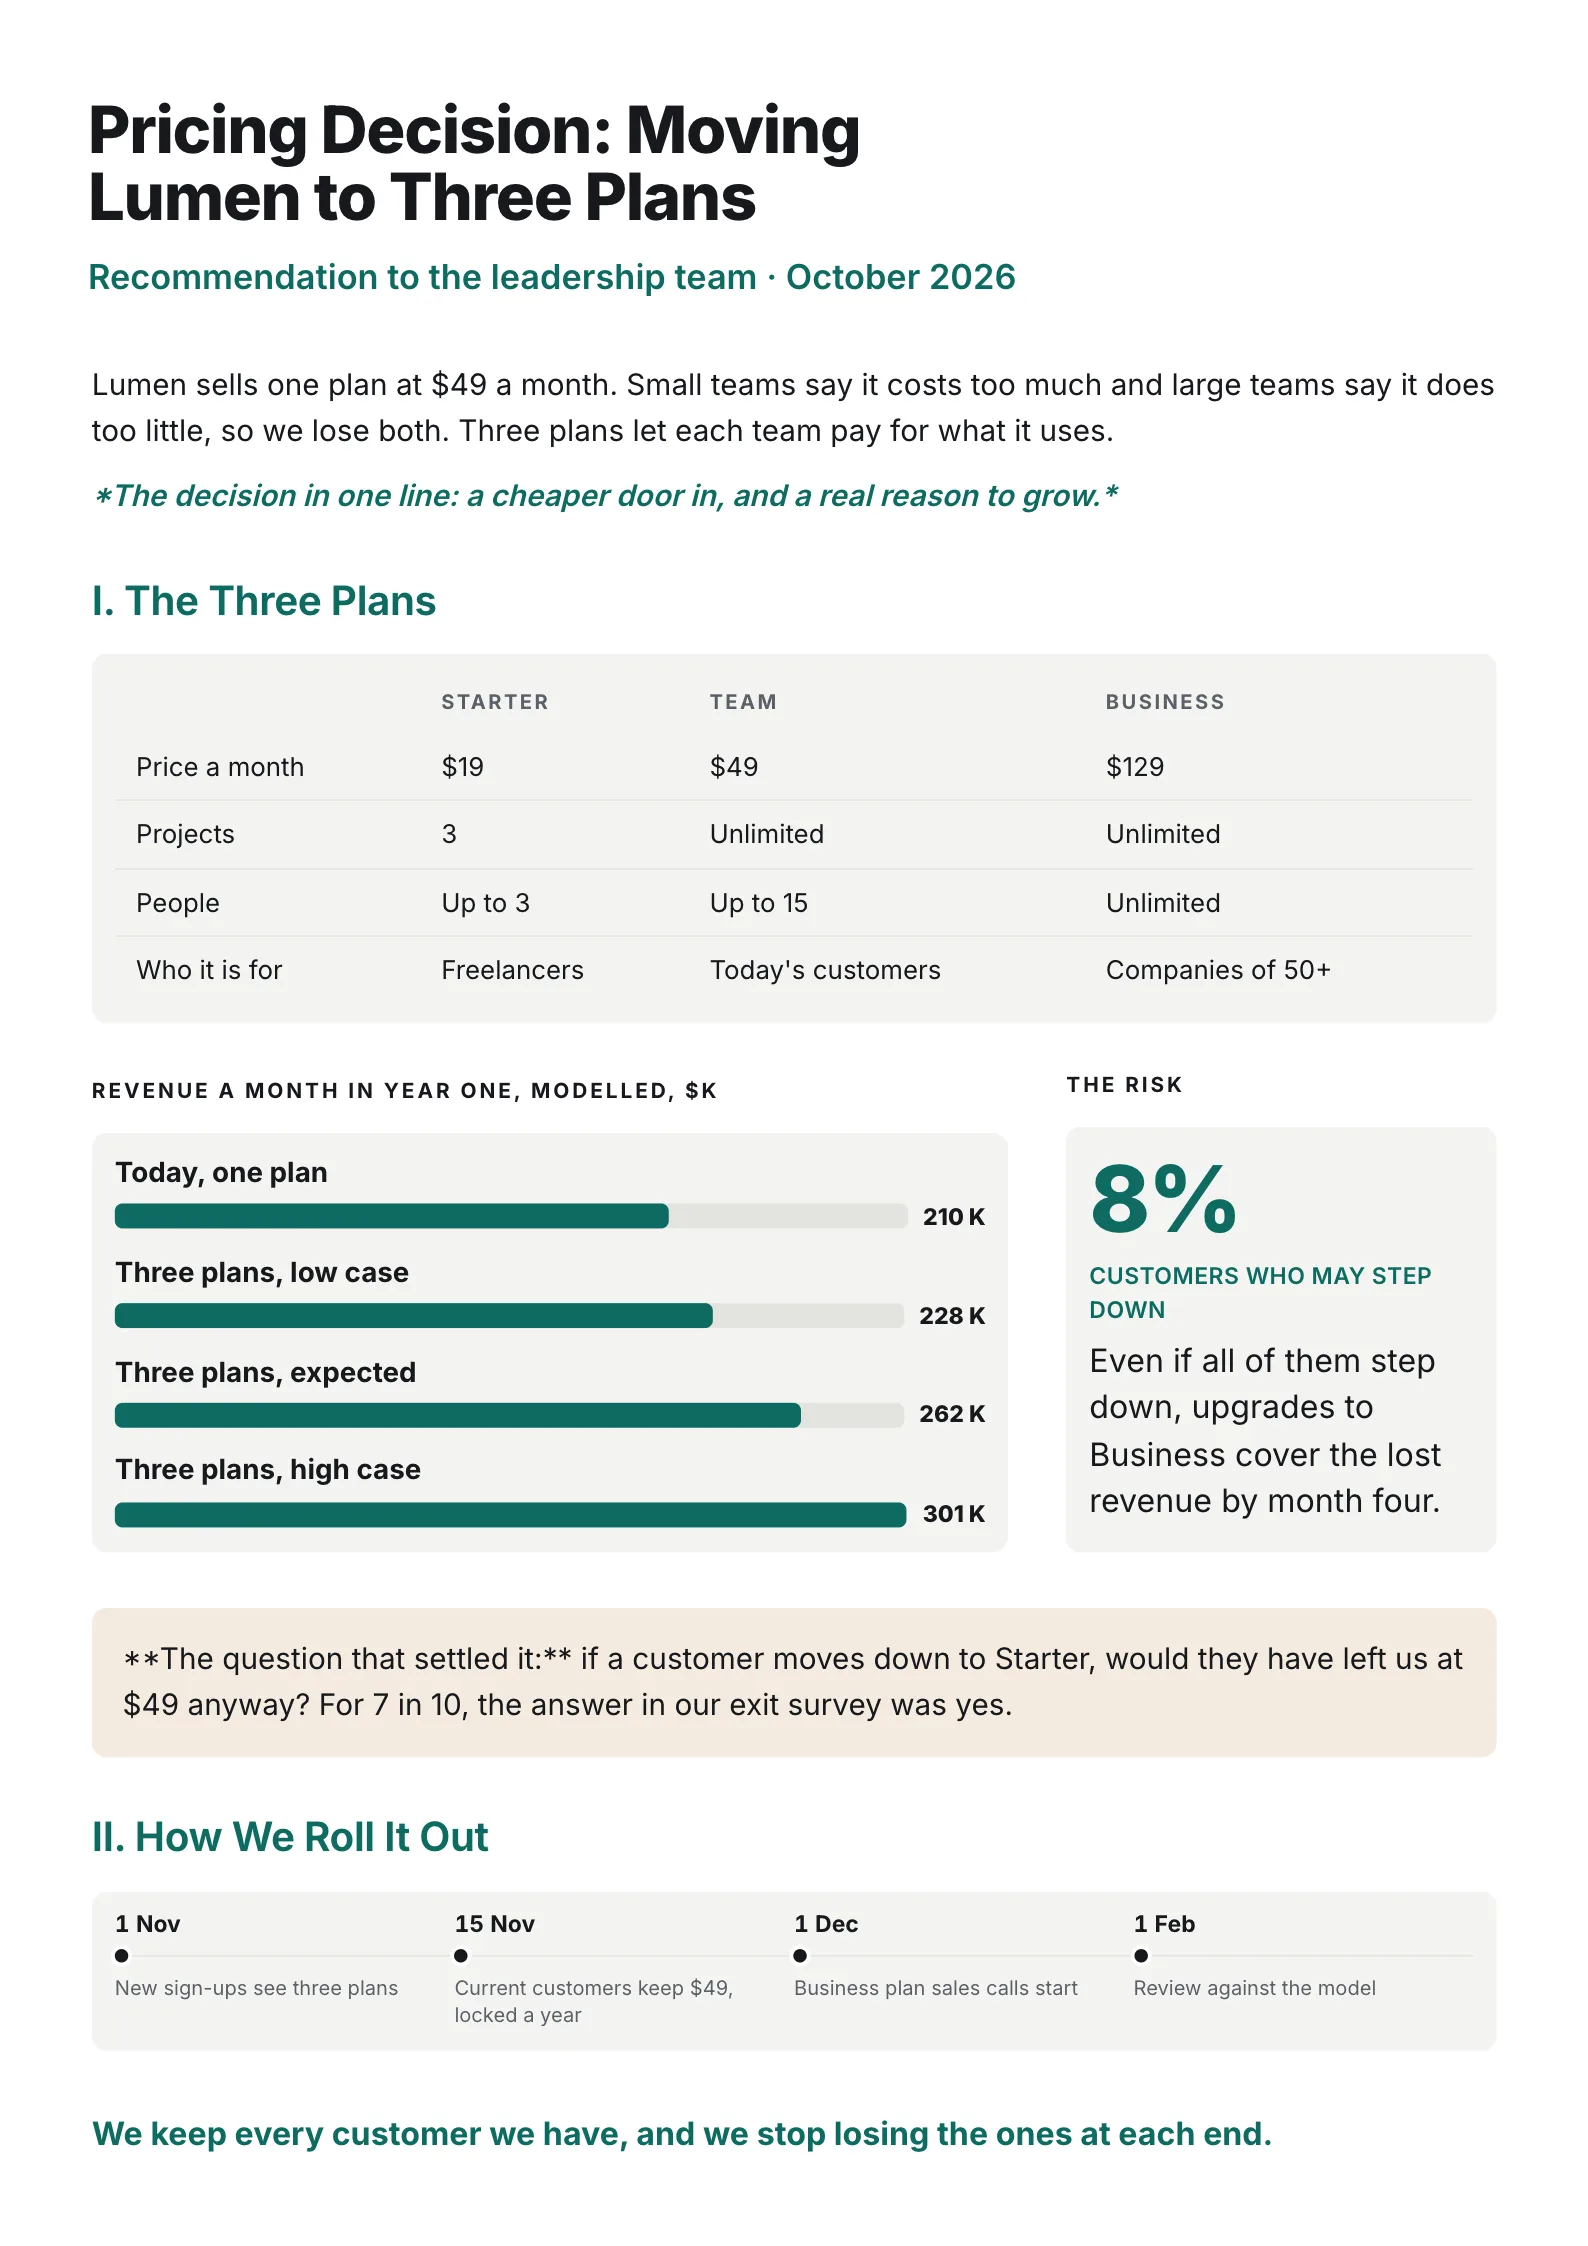 Pricing Decision BriefEdit for free(opens in a new tab)
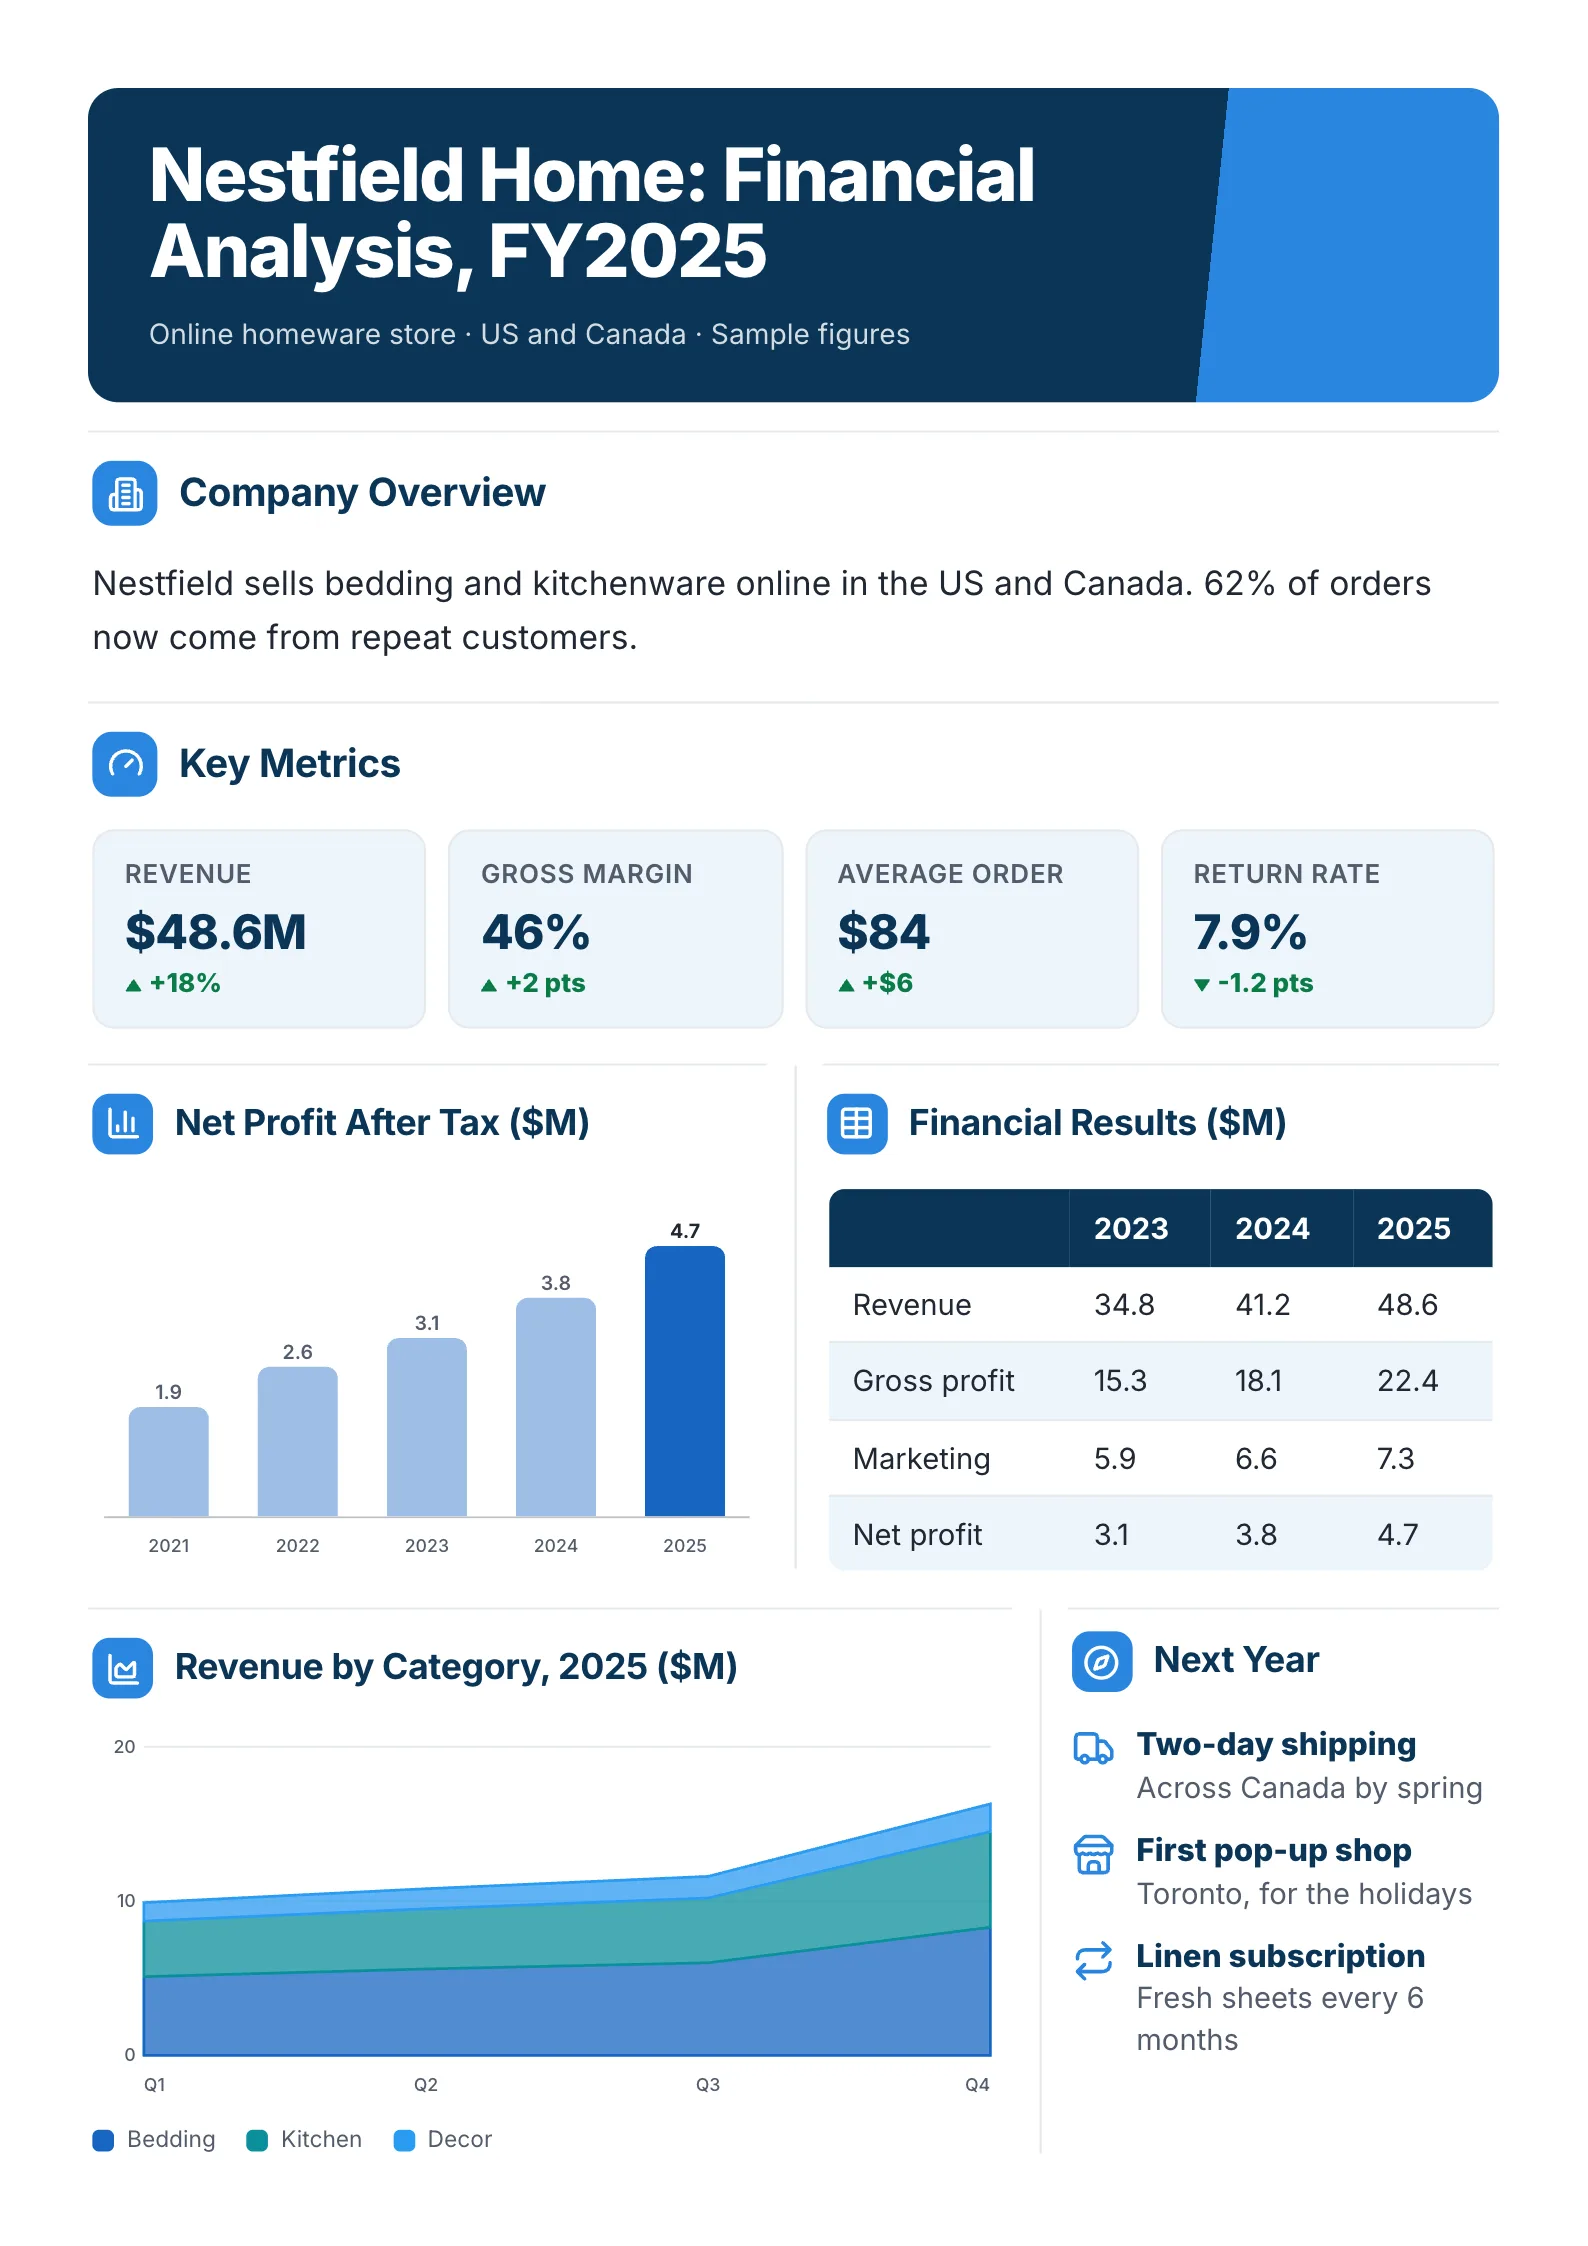 E-Commerce Financial AnalysisEdit for free(opens in a new tab)
The examples were made with MakeOnepagers. Each one opens as a template you can edit for free: every word, chart and color.
What are unit economics?
Unit economics describe the revenue and costs tied to one unit of a business. You choose the unit:
- A customer, for subscriptions and repeat purchases. This is the most common choice.
- An order, for shops where most buyers purchase once.
- A ride, a meal, a booking or a seat, for marketplaces and services.
Once the unit is chosen, the question is simple. Does each unit, over its life, bring in more margin than it cost to acquire and serve? If yes, growth makes the business stronger. If no, growth makes the losses bigger.
The 5 numbers in unit economics
- Revenue per unit. What one customer pays per month, or one order is worth.
- Contribution margin per unit. Revenue minus the costs that rise with each unit: product, packaging, shipping, transaction fees, support per customer. Also called gross margin per unit when only the cost of goods is subtracted.
- Customer acquisition cost (CAC). Total sales and marketing spend for a period divided by the new customers won in that period.
- Lifetime value (LTV). The contribution margin a customer brings in over the whole time they stay.
- CAC payback. How many months of margin it takes to earn back the cost of winning the customer.
Two ratios follow from them:
- LTV to CAC: lifetime value divided by acquisition cost. Many investors look for 3 to 1 or better as a rule of thumb, though what is healthy depends on the business.
- Payback in months: CAC divided by monthly margin per customer. Shorter means less cash is tied up in growth.
The formulas
- Contribution margin per month = price per month minus variable cost per month
- Average customer lifetime in months = 1 ÷ monthly churn rate
- LTV = contribution margin per month × average lifetime in months
- CAC = sales and marketing spend ÷ new customers won
- LTV to CAC = LTV ÷ CAC
- Payback in months = CAC ÷ contribution margin per month
For a business where customers buy once, LTV is simply the margin on the average order, and the ratio compares that with the cost of winning the order.
A free unit economics template
Copy this into a document, or open one of the examples further down and edit it.
| Part | What to write, with an example |
|---|---|
| Title | Business and period. Unit Economics: Monthly Snack Box, Q3 |
| The unit | One subscriber |
| Revenue per unit | $40 a month |
| Variable cost per unit | $22 a month: product, packing, shipping, fees |
| Contribution margin | $18 a month, 45% |
| Churn and lifetime | 6% a month, about 16.7 months |
| LTV | $300 |
| CAC | $36,000 spend ÷ 400 new subscribers = $90 |
| LTV to CAC and payback | 3.3 to 1; 5 months |
| What moves it most | The one or two levers, with the effect of each |
A worked example: a monthly snack box
The figures below are an example, made up for this guide so every step can be checked with a calculator. Use your own.
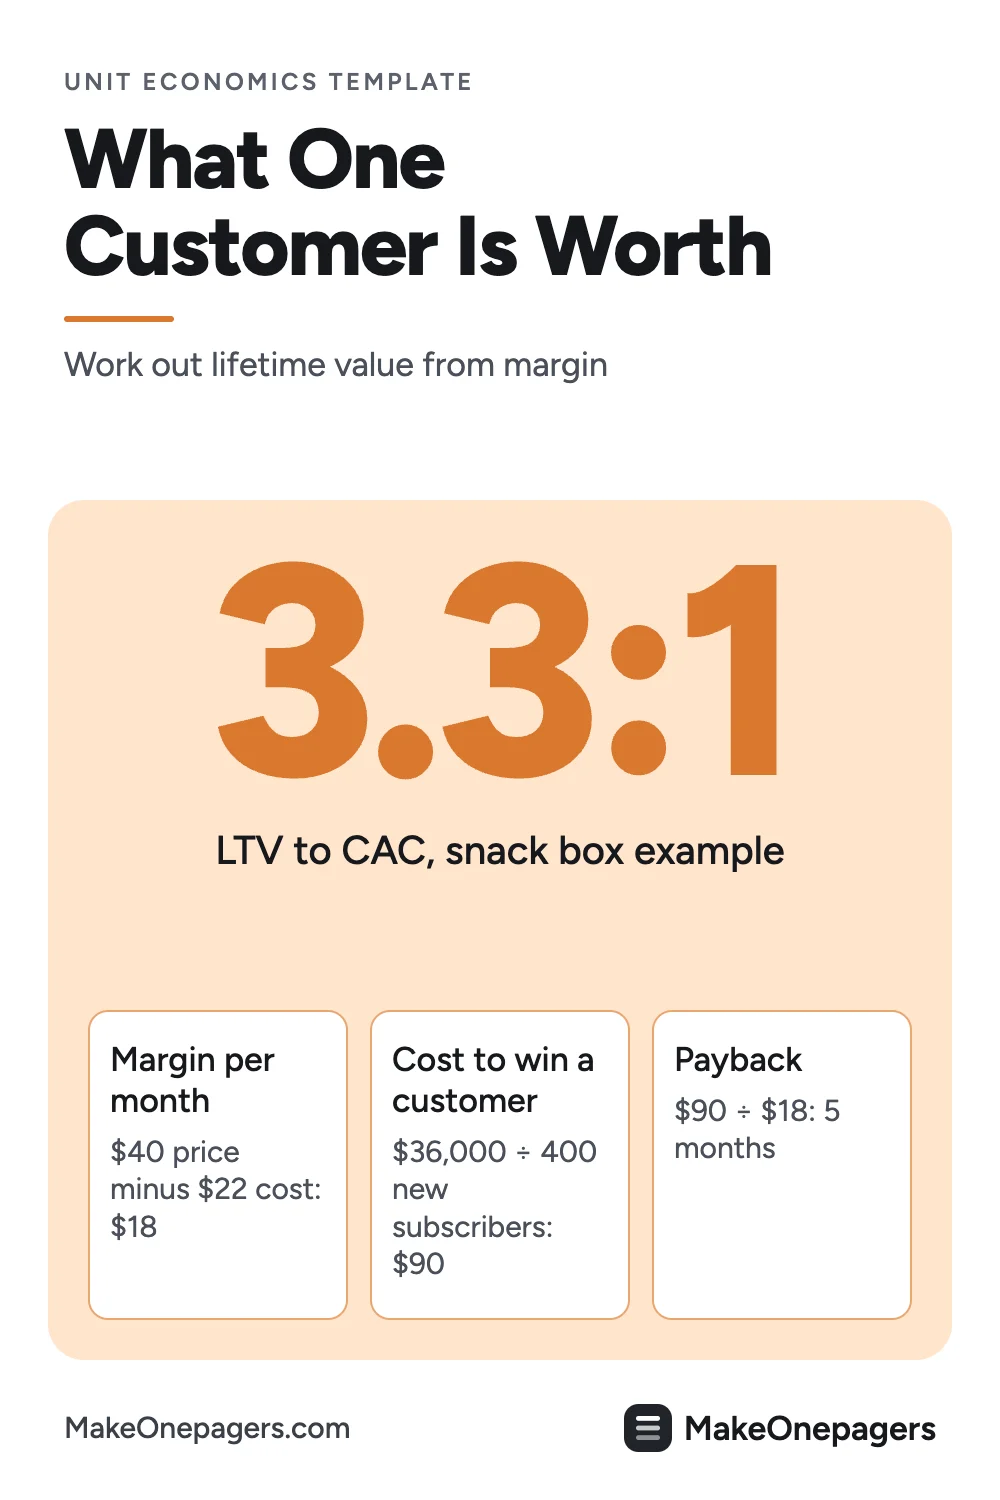
A subscription snack box costs $40 a month. Each box costs $22 to fill, pack and ship, including transaction fees.
Contribution margin per month: $40 minus $22 = $18, or 45% of the price.
Churn and lifetime: 6% of subscribers cancel each month. Average lifetime is 1 ÷ 0.06 = 16.7 months.
LTV: $18 × 16.7 = $300 (rounded).
CAC: in the quarter, the business spent $36,000 on ads and promotions and won 400 new subscribers. $36,000 ÷ 400 = $90.
LTV to CAC: $300 ÷ $90 = 3.3 to 1.
Payback: $90 ÷ $18 = 5 months.
So each subscriber earns back the cost of winning them in five months, and brings in a little over three times that cost across their life. The business makes money on each customer, as long as these numbers hold.
What moves it most
| Change | New LTV | New LTV to CAC | New payback |
|---|---|---|---|
| None (as above) | $300 | 3.3 to 1 | 5 months |
| Churn falls from 6% to 5% | $360 | 4.0 to 1 | 5 months |
| CAC rises to $120 | $300 | 2.5 to 1 | 6.7 months |
| Variable cost falls $2 to $20 | $333 | 3.7 to 1 | 4.5 months |
The table makes the priorities obvious. A one-point cut in churn adds $60 of lifetime value per subscriber. A rise in ad costs to $120 pushes the ratio to 2.5 to 1 and the payback close to seven months, which ties up more cash with every new customer. The summary line: "Every subscriber is profitable at today's costs. Our biggest lever is churn, and our biggest risk is rising ad costs."
Unit economics examples
- Investor snapshot: the place unit economics usually end up, beside traction, the market and the raise.
- Churn analysis: when churn is the lever, show who leaves, when and why.
- Pricing decision brief: when price is the lever, lay out the options and their effect on margin.
Unit economics in a spreadsheet or on one page?
Searches for this template often add "excel" or "google sheets", and a spreadsheet is the right place to build the model, test cohorts and run scenarios. Investors and boards, though, want the answer: the five numbers, the two ratios and what moves them. Put the model's output on one page, with the assumptions stated. If your model or investor deck already exists as a PDF, the free AI One-Pager generator reads a PDF, Word or PowerPoint file and gives it back as a designed One-Pager. Check every number against the model before you share it.
How to work out unit economics in 6 steps
- Choose the unit: a customer, an order or a booking.
- Work out revenue and variable cost per unit, and the contribution margin.
- Measure churn from real cancellations, and turn it into an average lifetime.
- Work out LTV from margin, not revenue.
- Work out CAC from all sales and marketing spend in the period.
- Divide, then test the two or three changes most likely to happen.
Unit economics mistakes
- LTV from revenue. $40 × 16.7 months is $668, more than double the $300 the business keeps. Always use margin.
- CAC from ads alone. Include salaries of the sales and marketing team, agencies and tools, or CAC looks cheaper than it is.
- Blended CAC hides bad channels. Free word-of-mouth customers make paid channels look better. Show CAC by channel where you can.
- Churn from one good month. Use several months, or cohorts, before trusting a lifetime figure.
- Ignoring payback. A 5 to 1 ratio with a 30-month payback can still run a business out of cash.
Make your unit economics
Open the free investor snapshot template and add your five numbers beside your traction, or drop your model into the free AI One-Pager generator and get a finished one-page view back.
Frequently asked questions
What is included in unit economics?
Revenue per unit, contribution margin per unit, customer acquisition cost, lifetime value and the payback period, plus the LTV to CAC ratio.
What is a good LTV to CAC ratio?
Many investors use 3 to 1 as a rule of thumb. A lower ratio can be fine if payback is short, and a higher one can mean you are spending too little on growth. Show the ratio with the payback beside it.
How do you calculate CAC?
Divide all sales and marketing spend for a period by the number of new customers won in that period. Include people, tools and agencies, not only ads.
How do unit economics work for a one-time purchase?
Use the order as the unit. Lifetime value is the margin on the average order, plus any repeat orders you can show, and CAC is compared with that.