BlogGuide
Sales Forecast Template: Free One-Page Sales Forecast and Example
A free one-page sales forecast template, three ways to build the number, a worked pipeline forecast you can check by hand and the mistakes that cause misses.

By MakeOnepagers Team
Updated · 7 min read
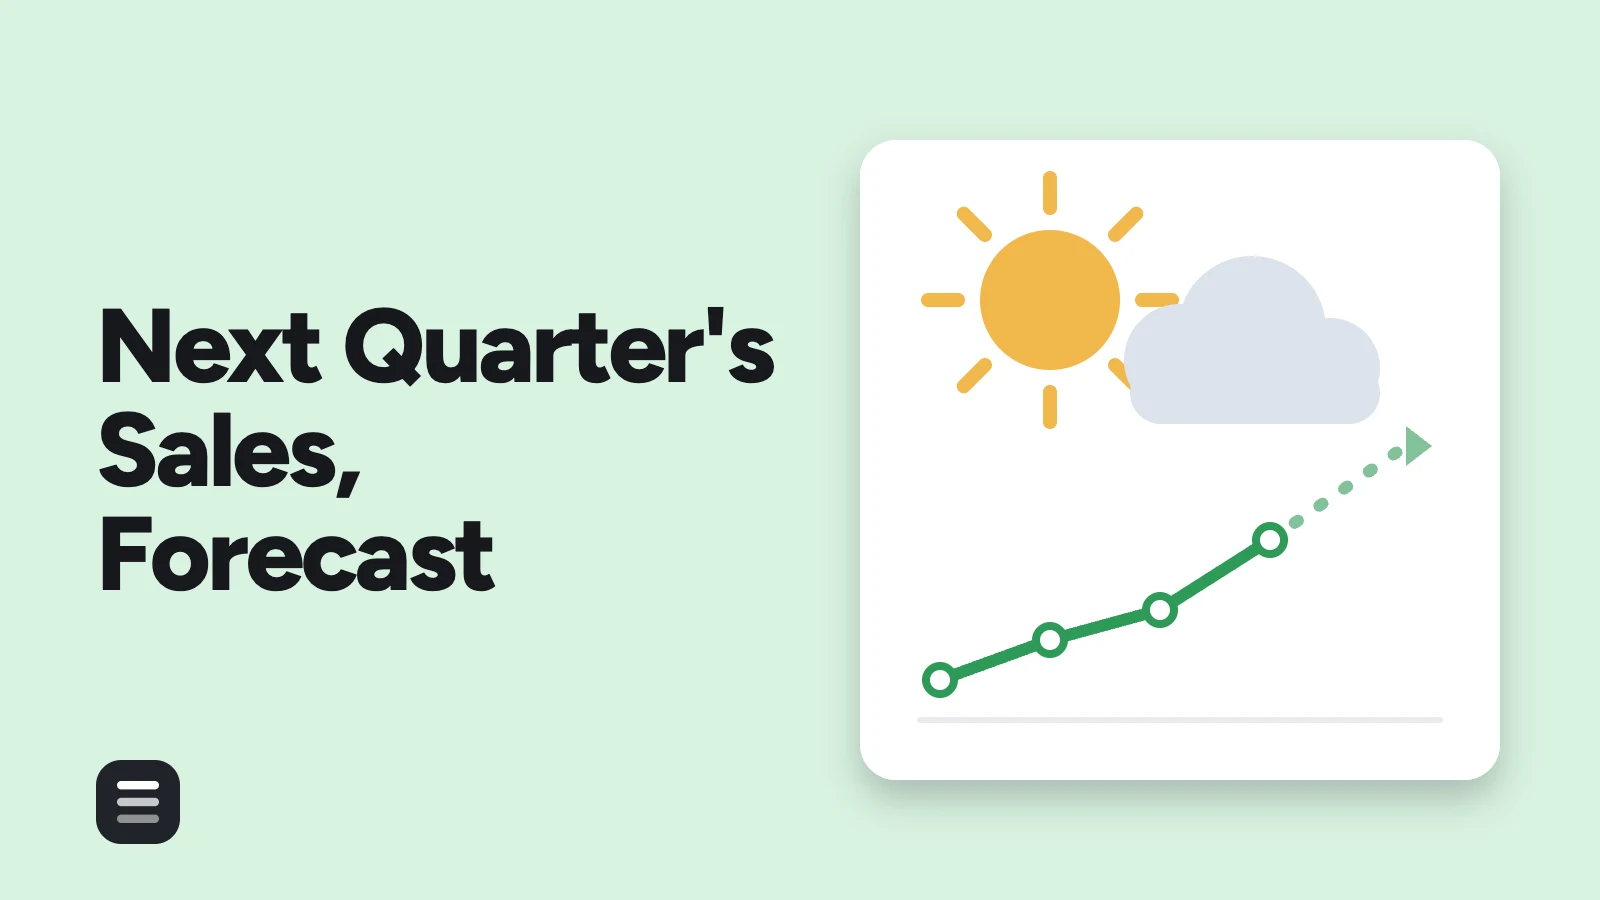
A sales forecast template helps you estimate how much you will sell in the coming month, quarter or year, and show everyone else how you got there. Hiring, buying stock, setting budgets and talking to investors all depend on that number, so a forecast that cannot explain itself is a risk. The spreadsheet behind it can be as detailed as you like. The version leadership reads fits on one page: the number, the range around it, the method, the assumptions and how accurate the last forecast was. Below are three ways to build a sales forecast, the parts every forecast needs, a free template you can copy and a worked example you can check with a calculator.
One‑Pager examples
Real One-Pagers made with MakeOnepagers. Open any one to edit it as your own.
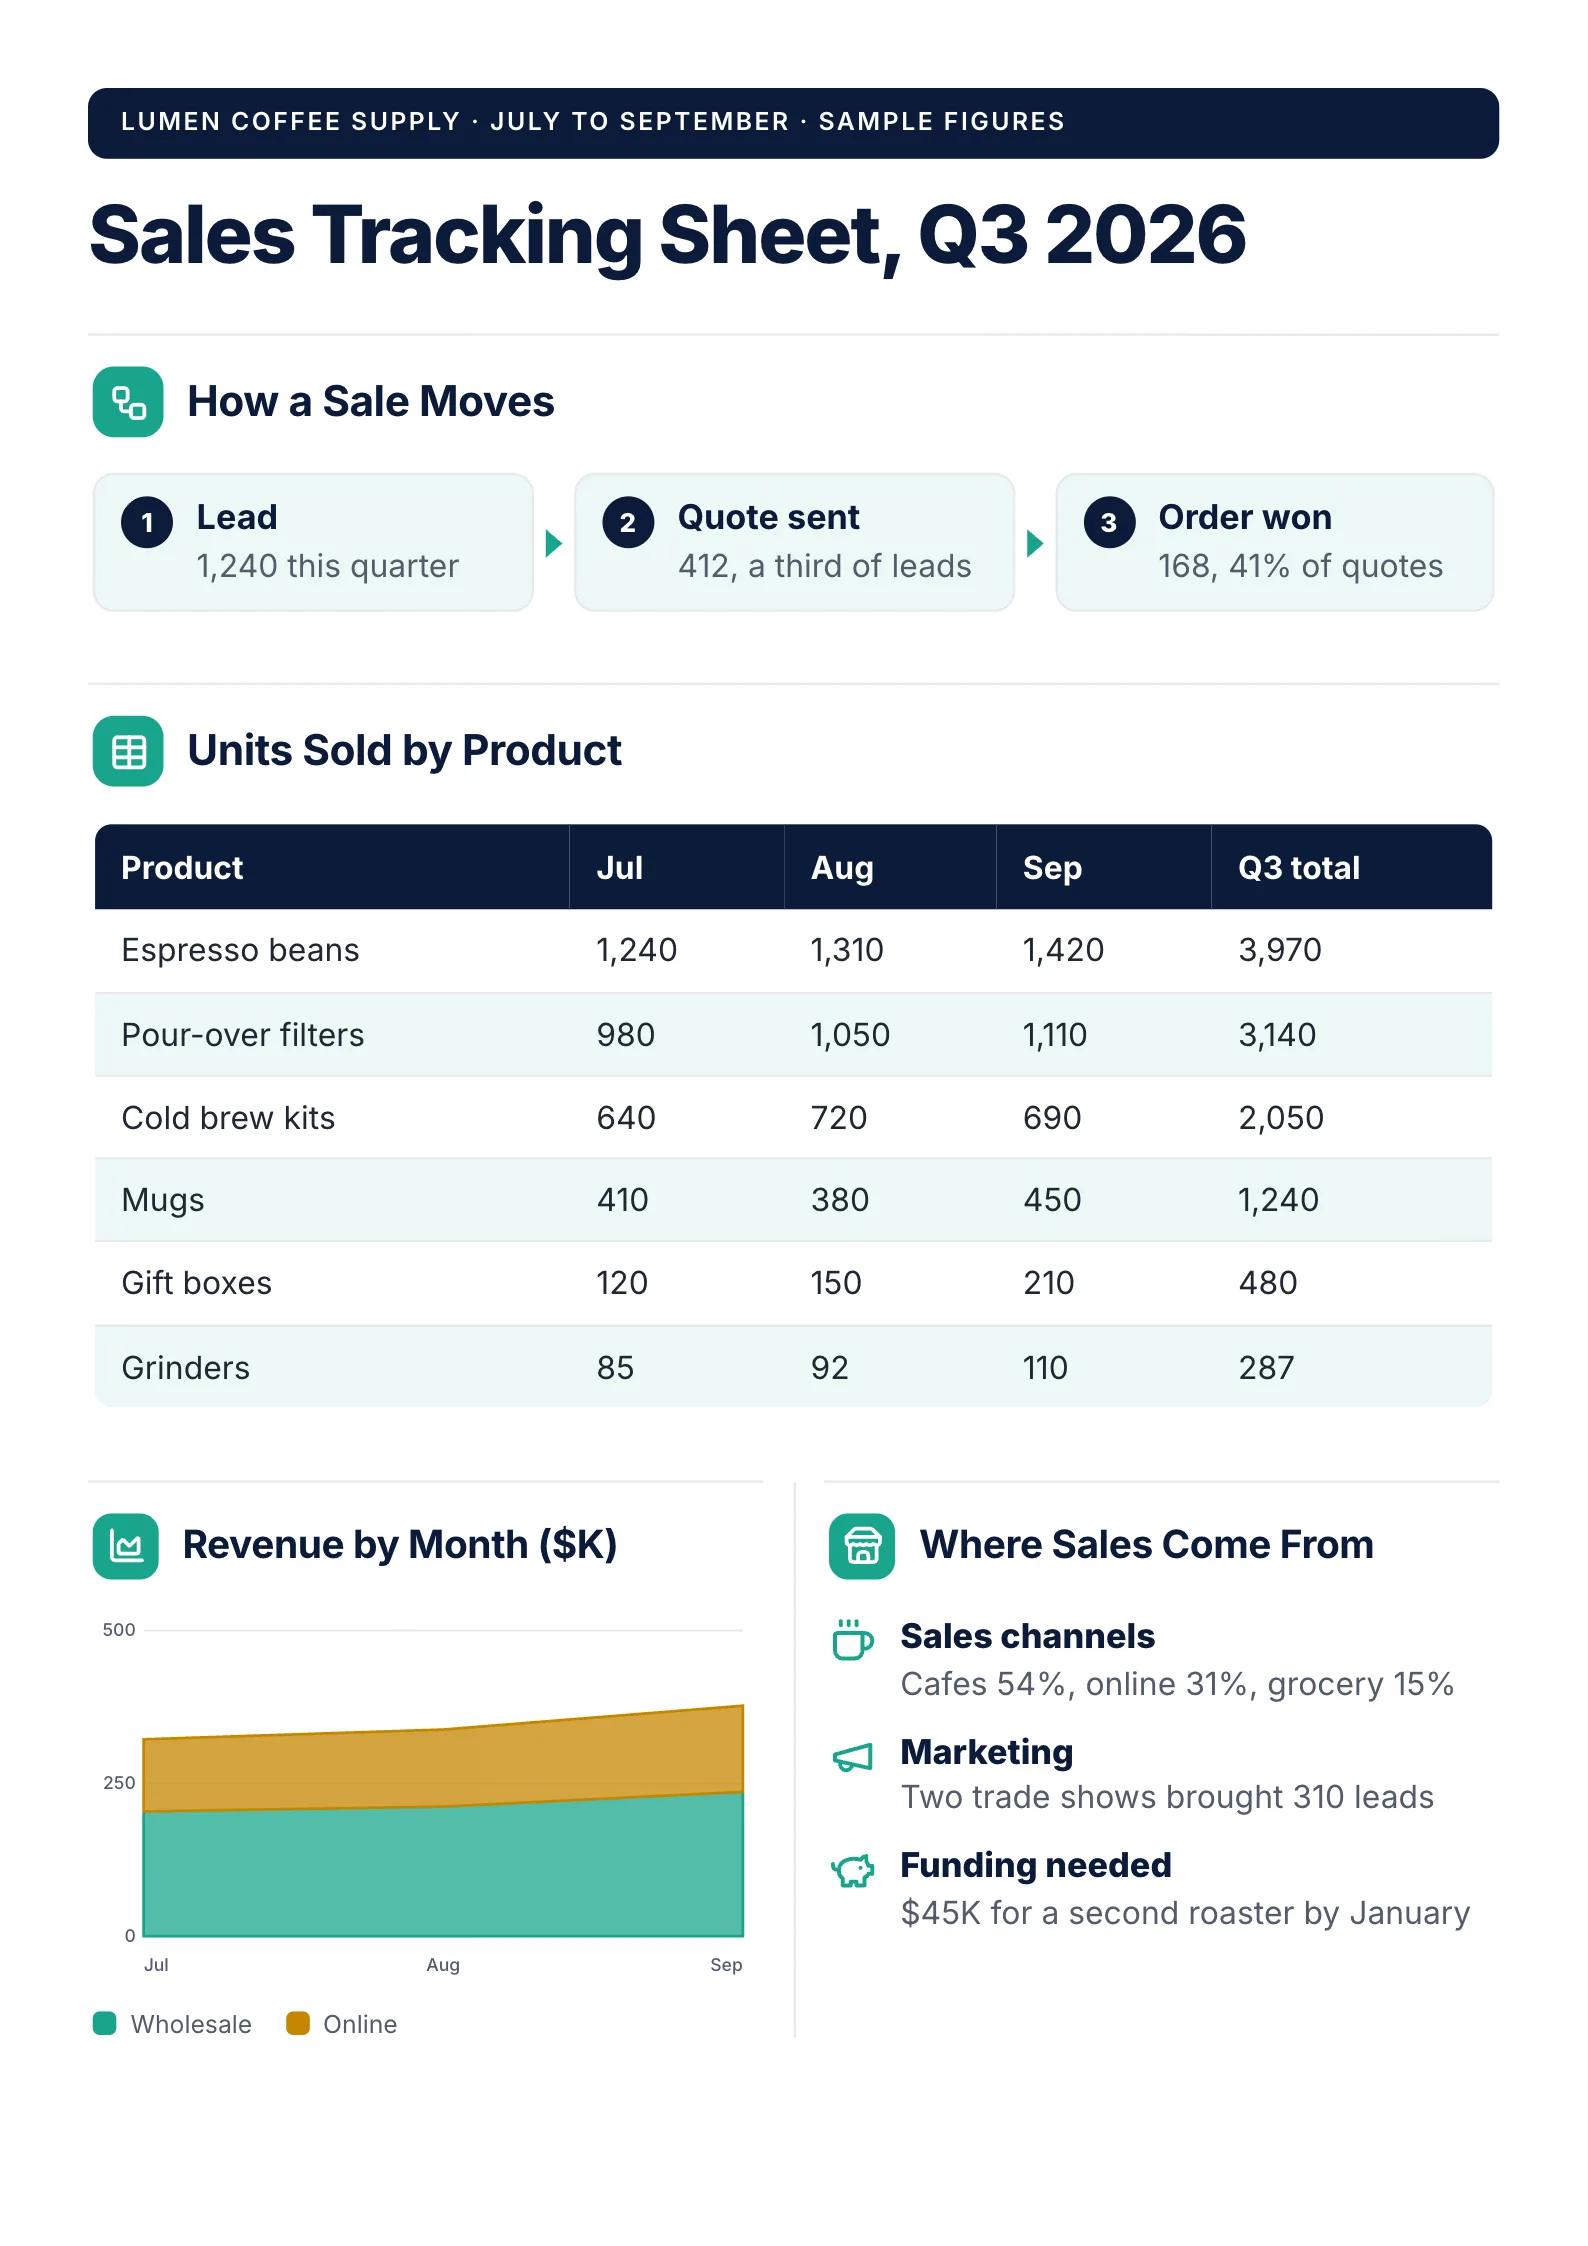 Sales Tracking SheetEdit for free(opens in a new tab)
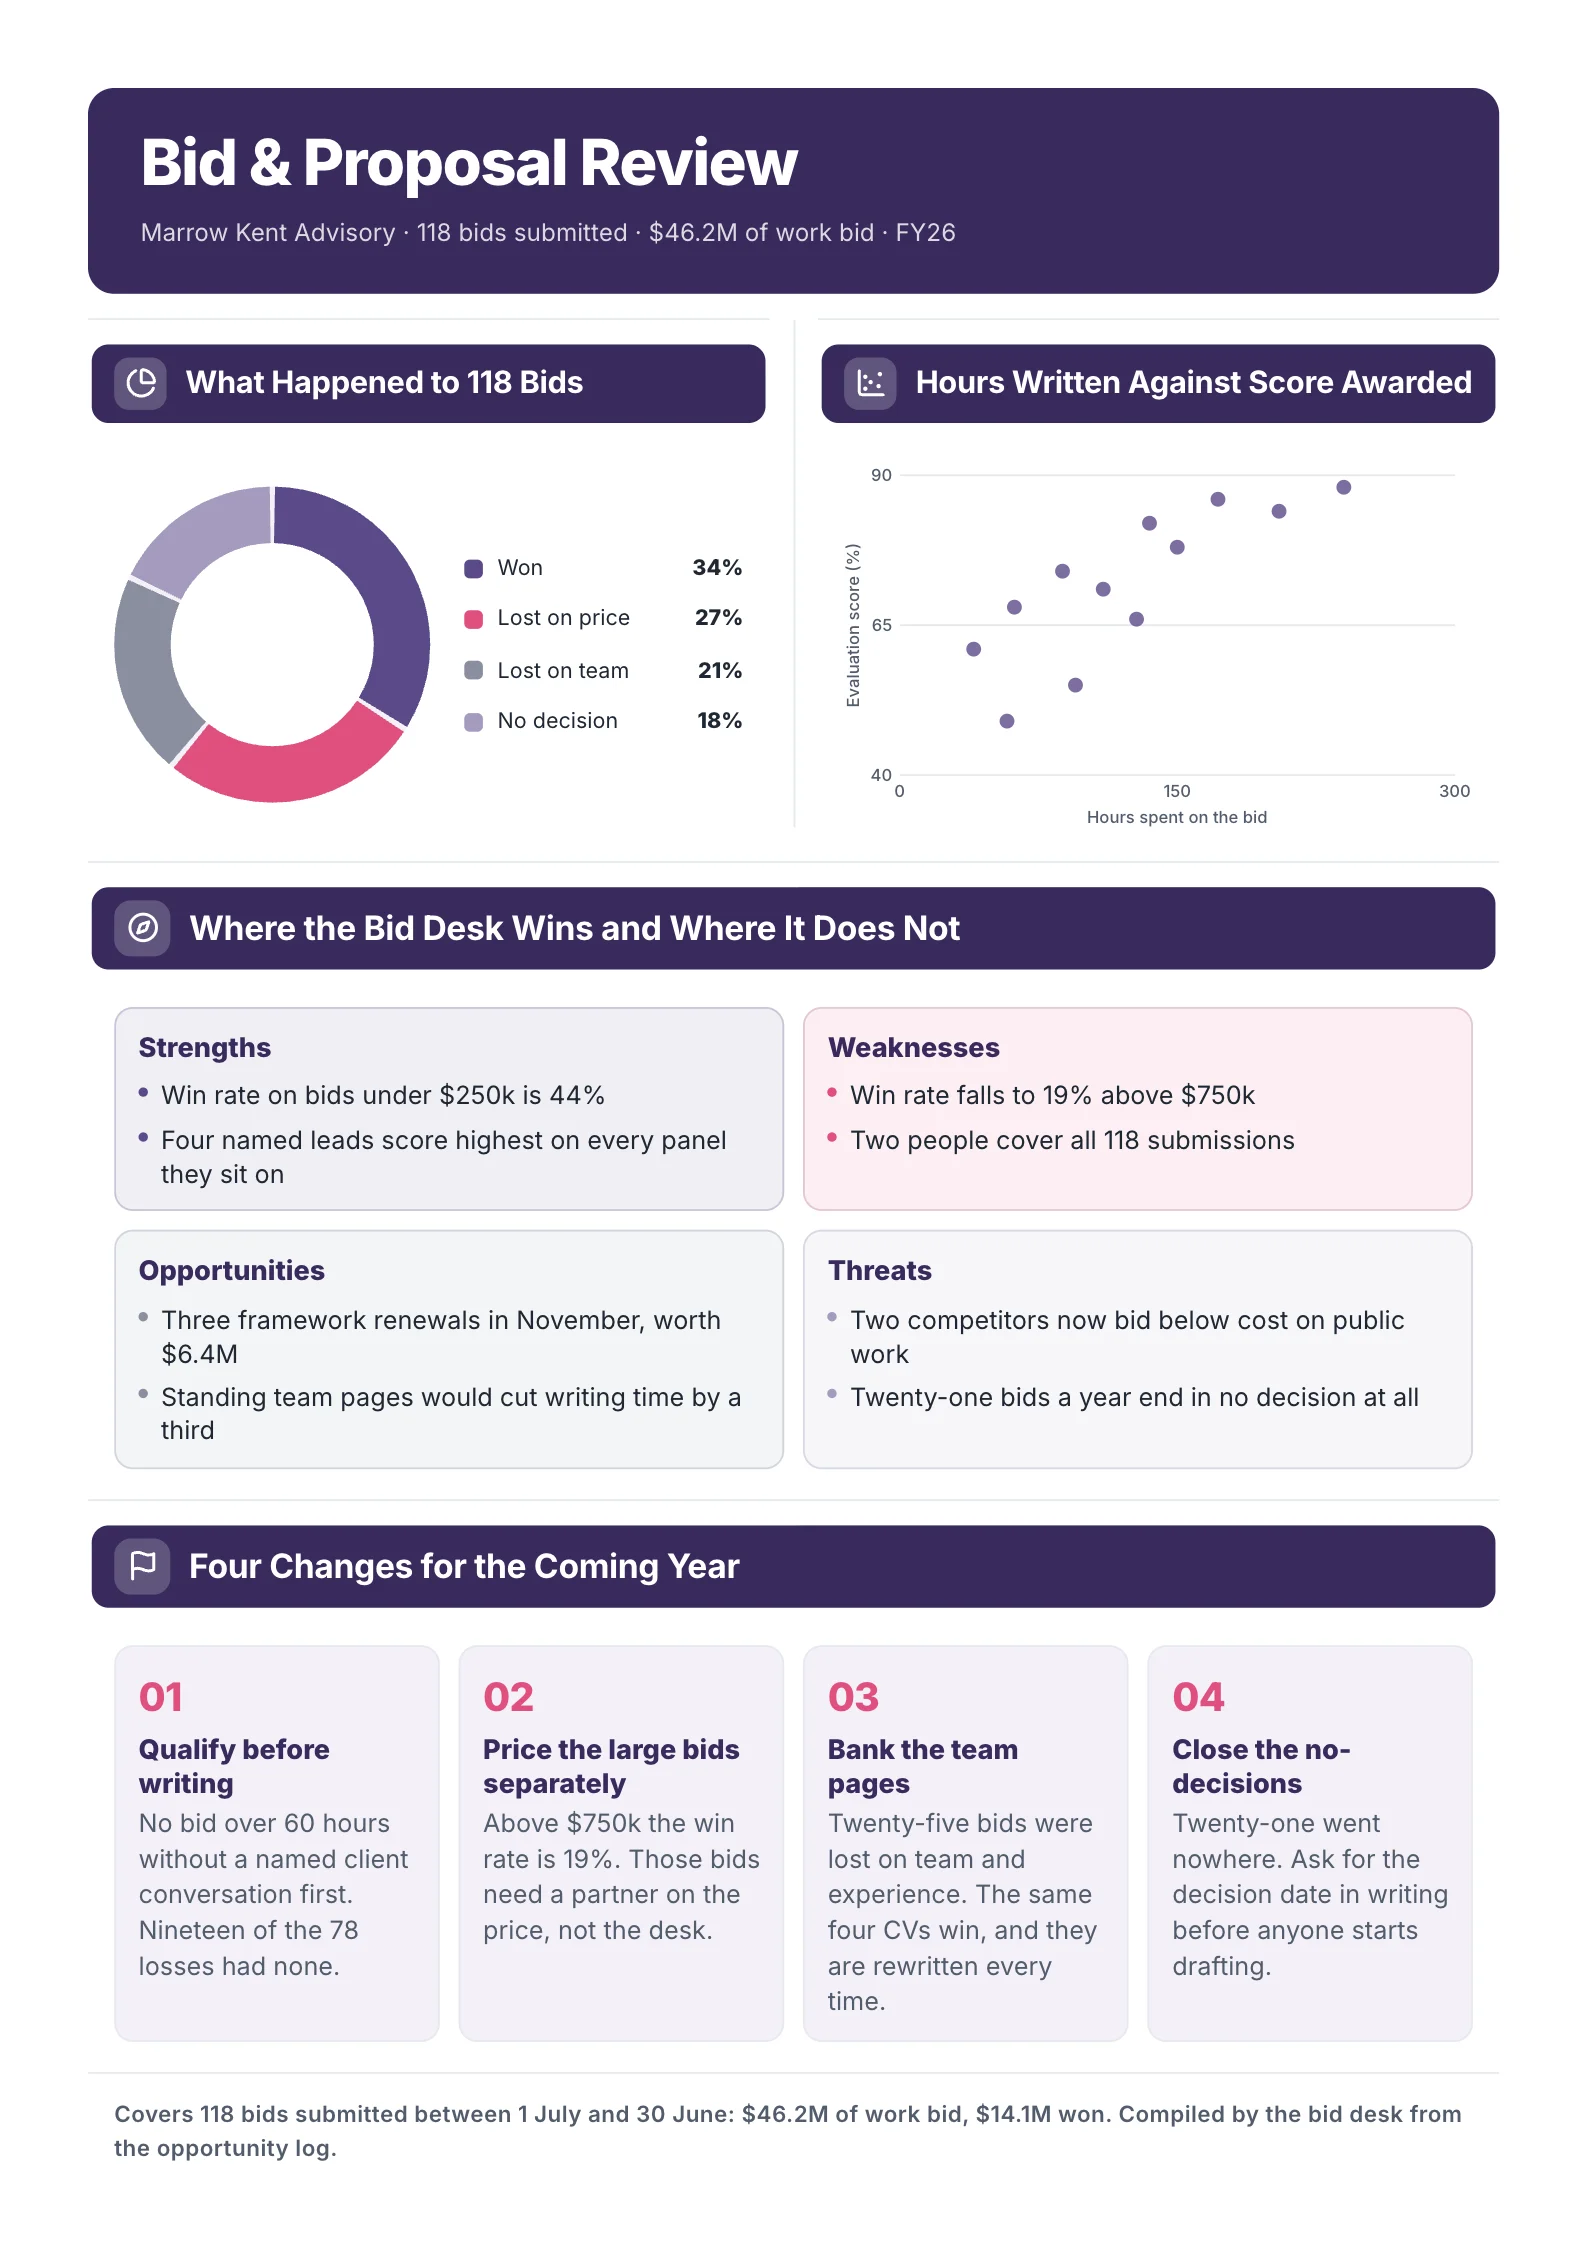
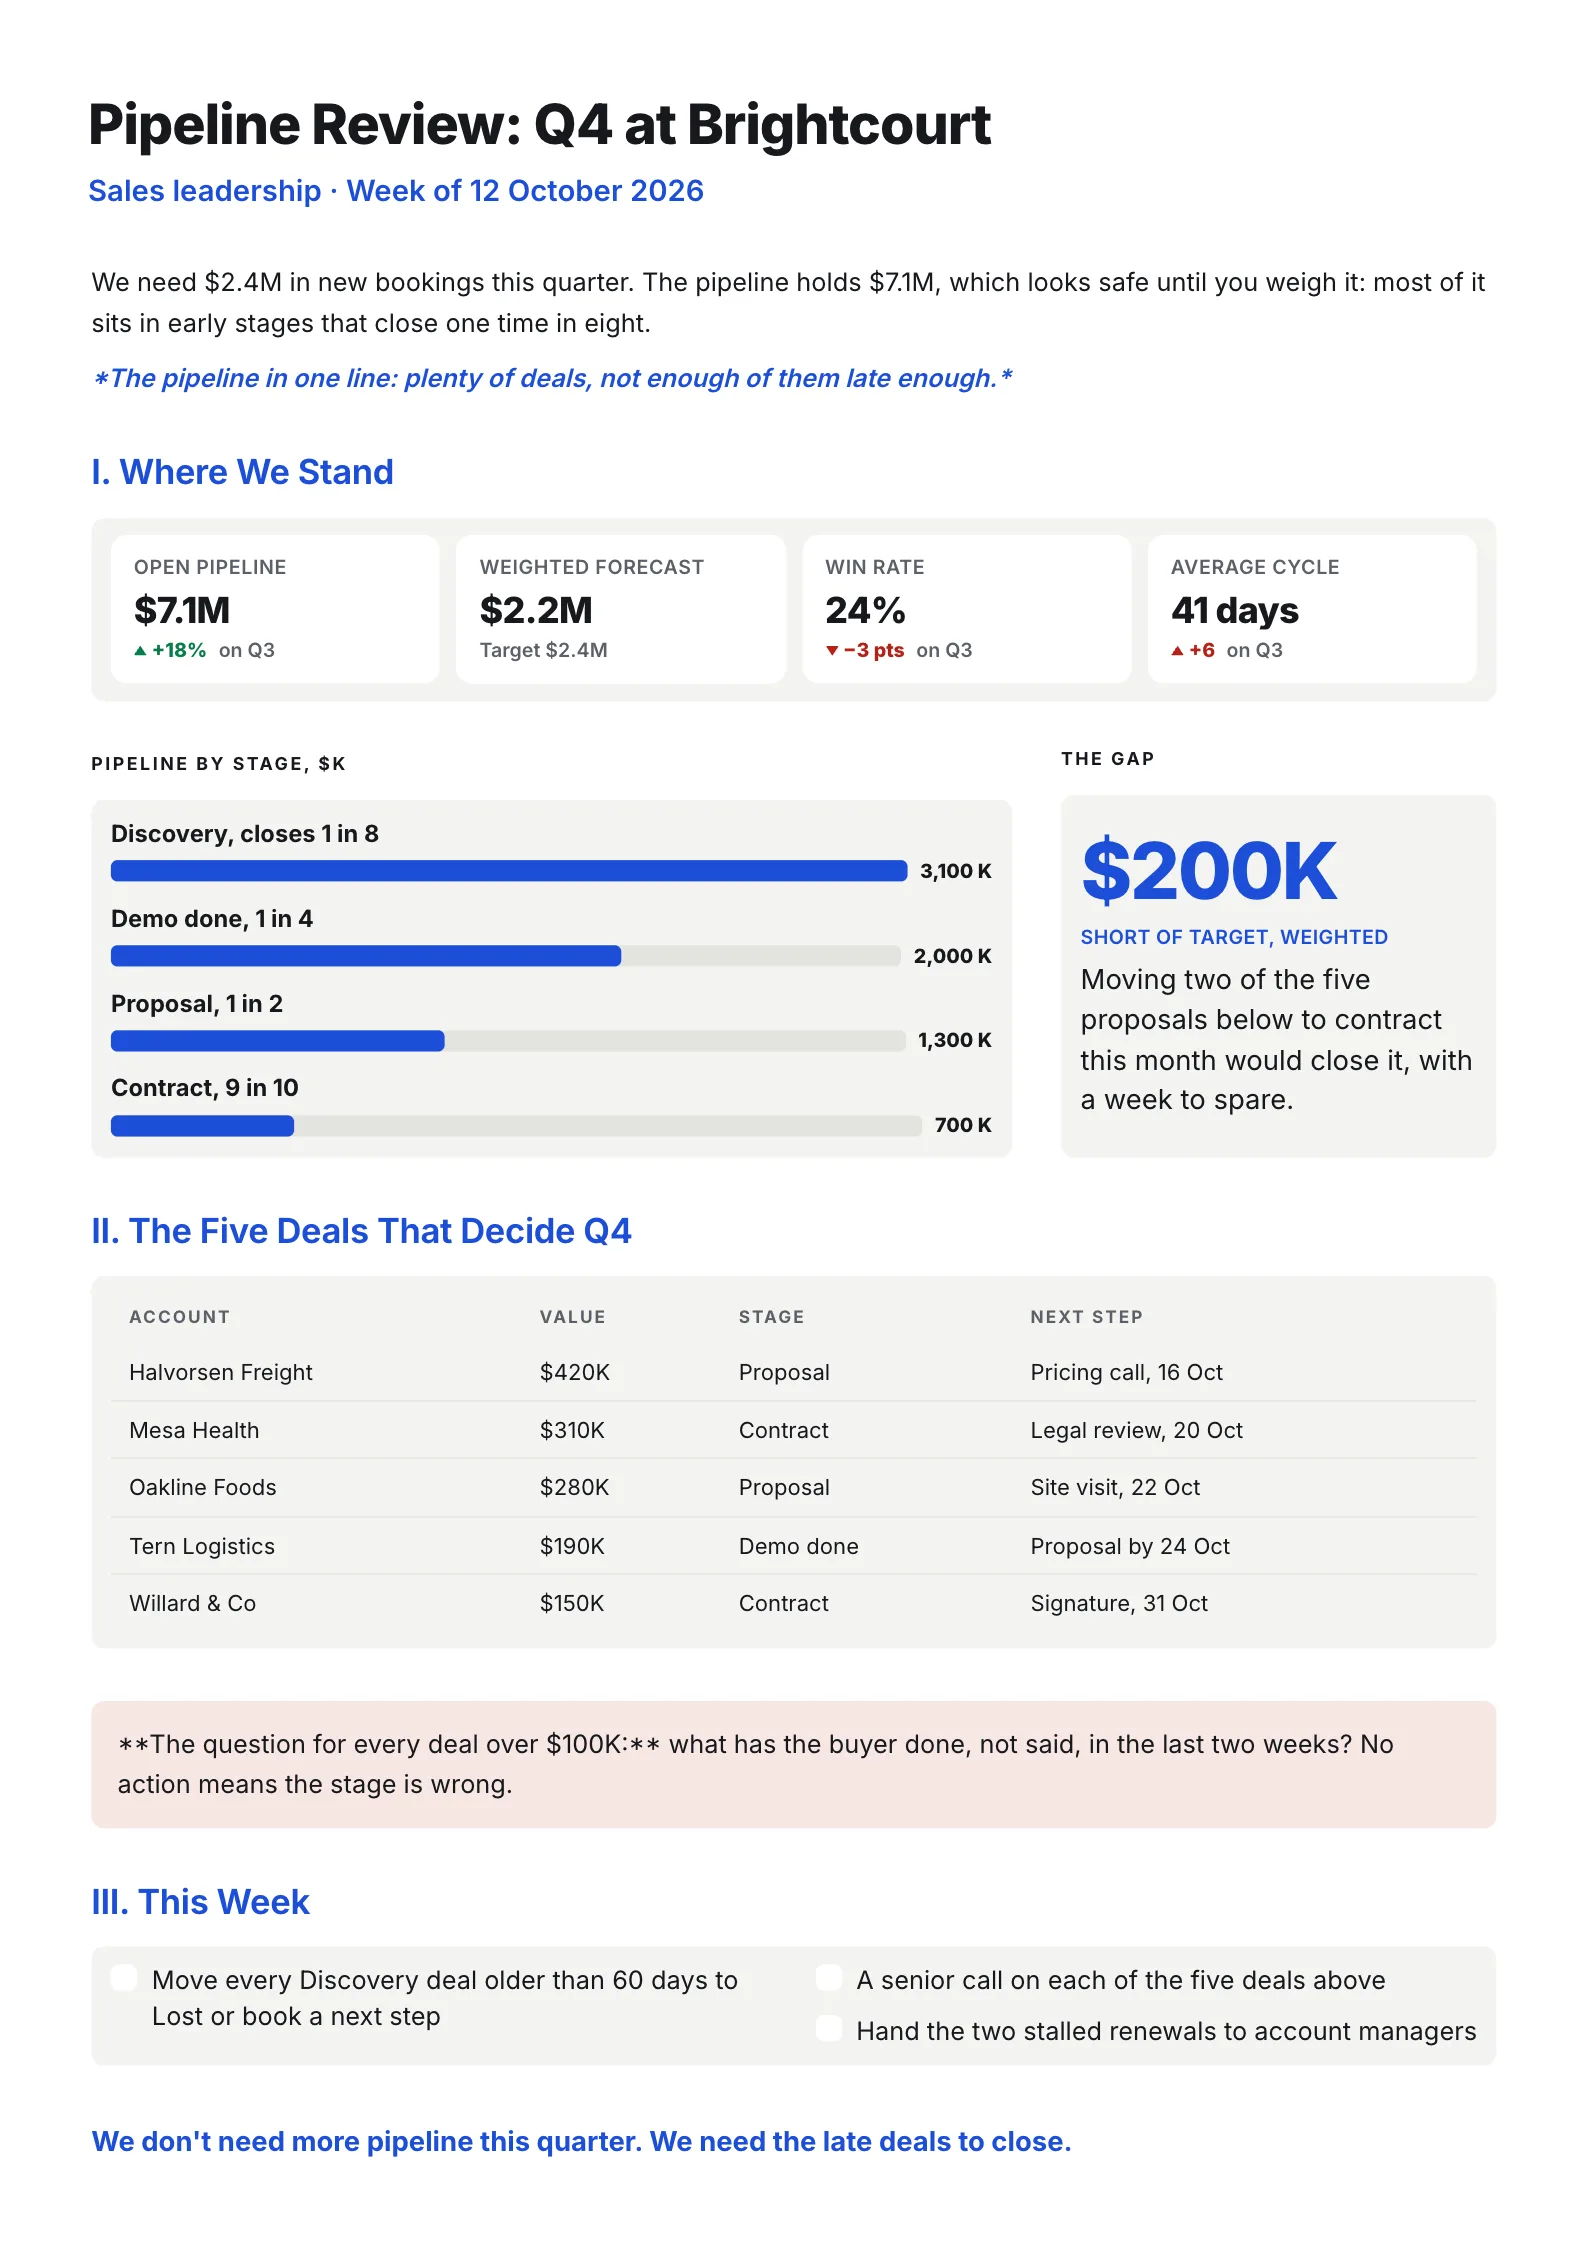 Pipeline BriefingEdit for free(opens in a new tab)
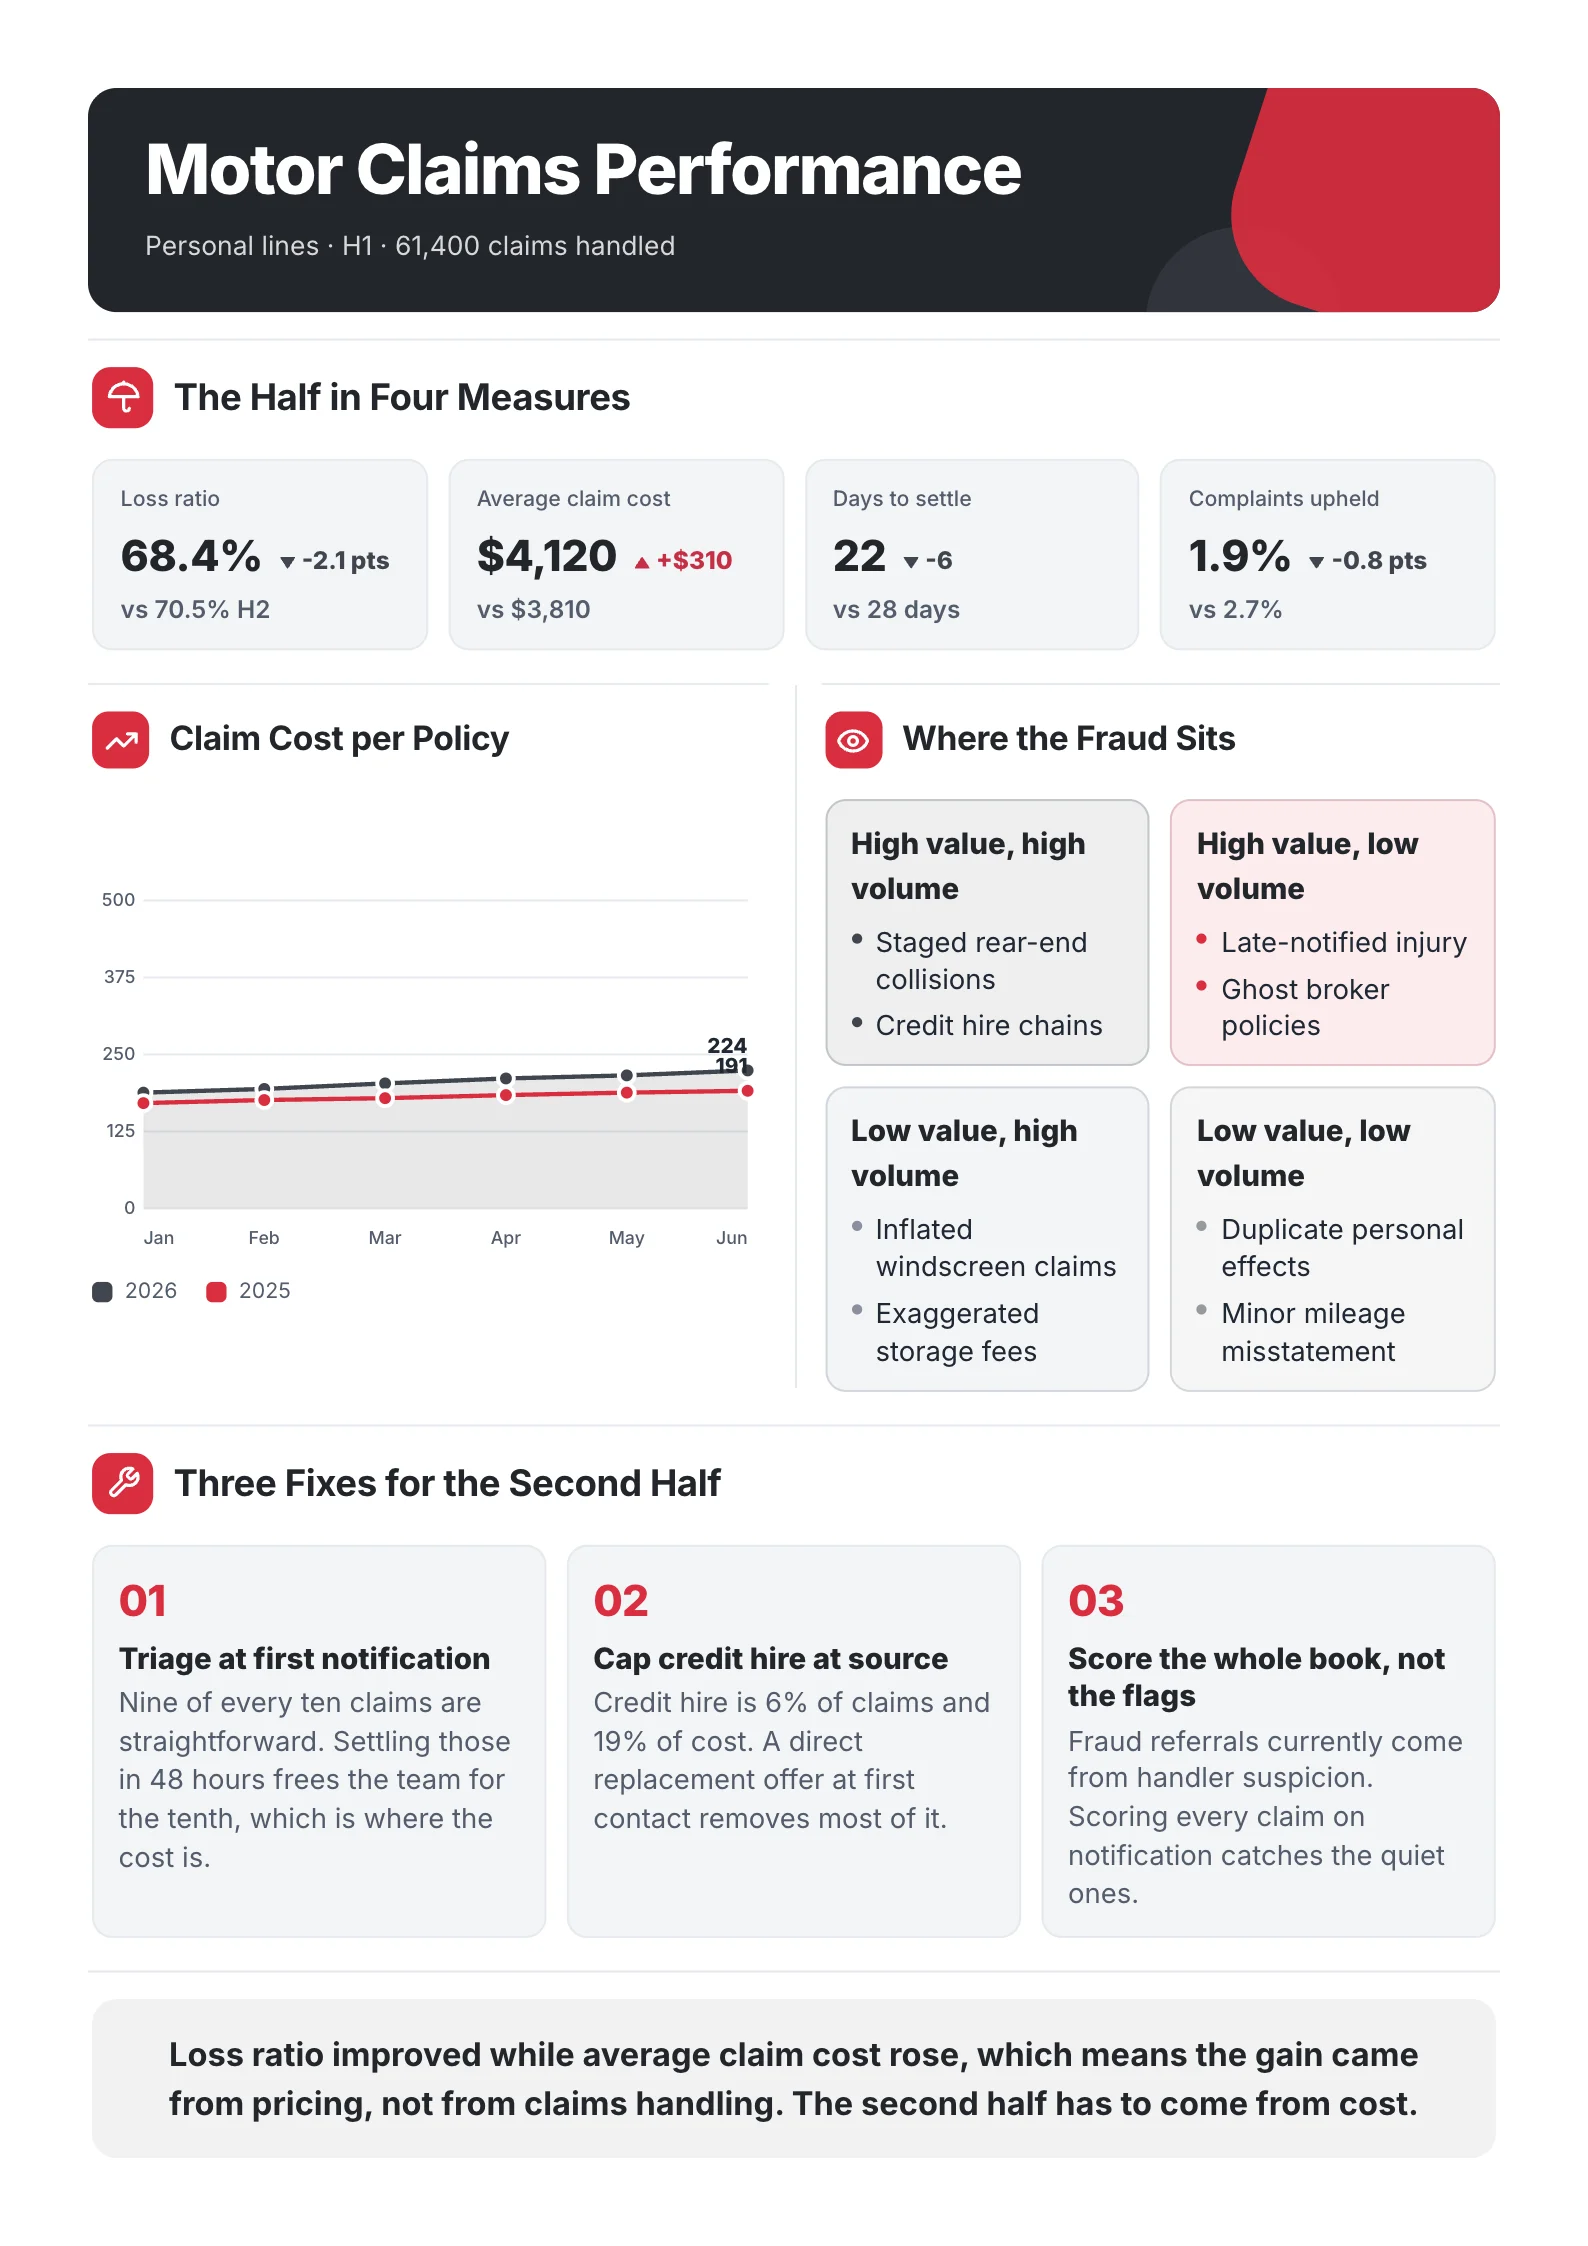
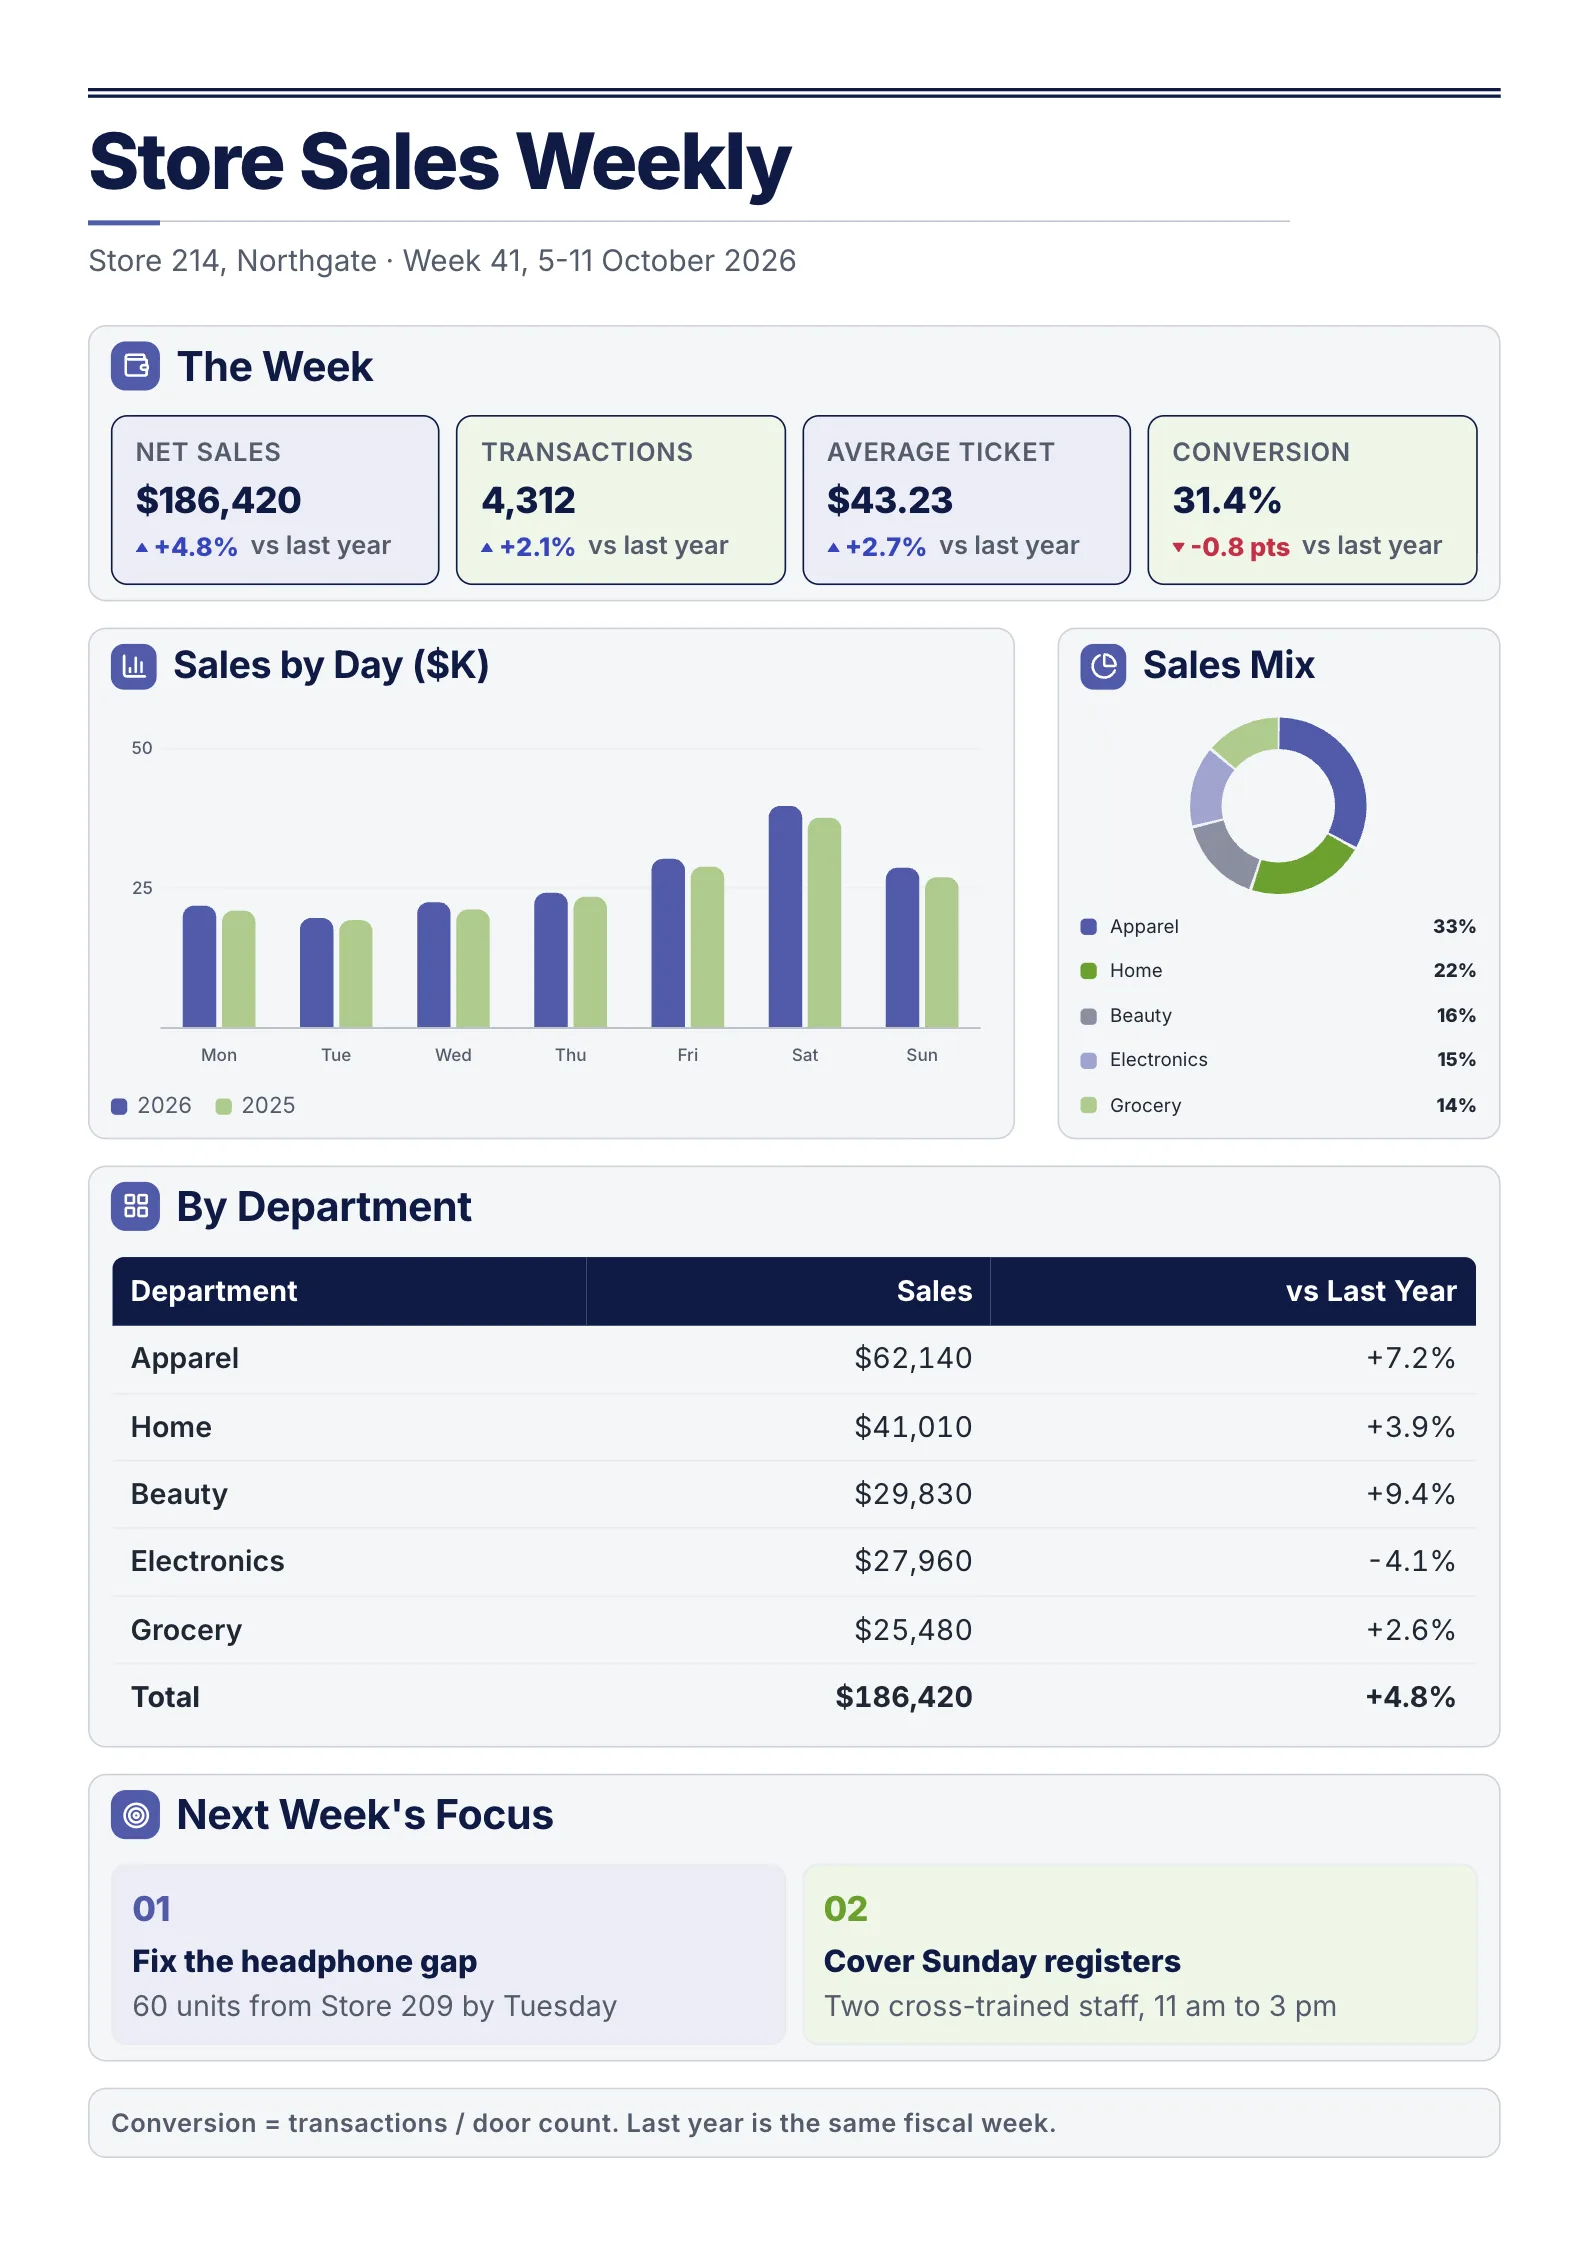 Store Sales WeeklyEdit for free(opens in a new tab)
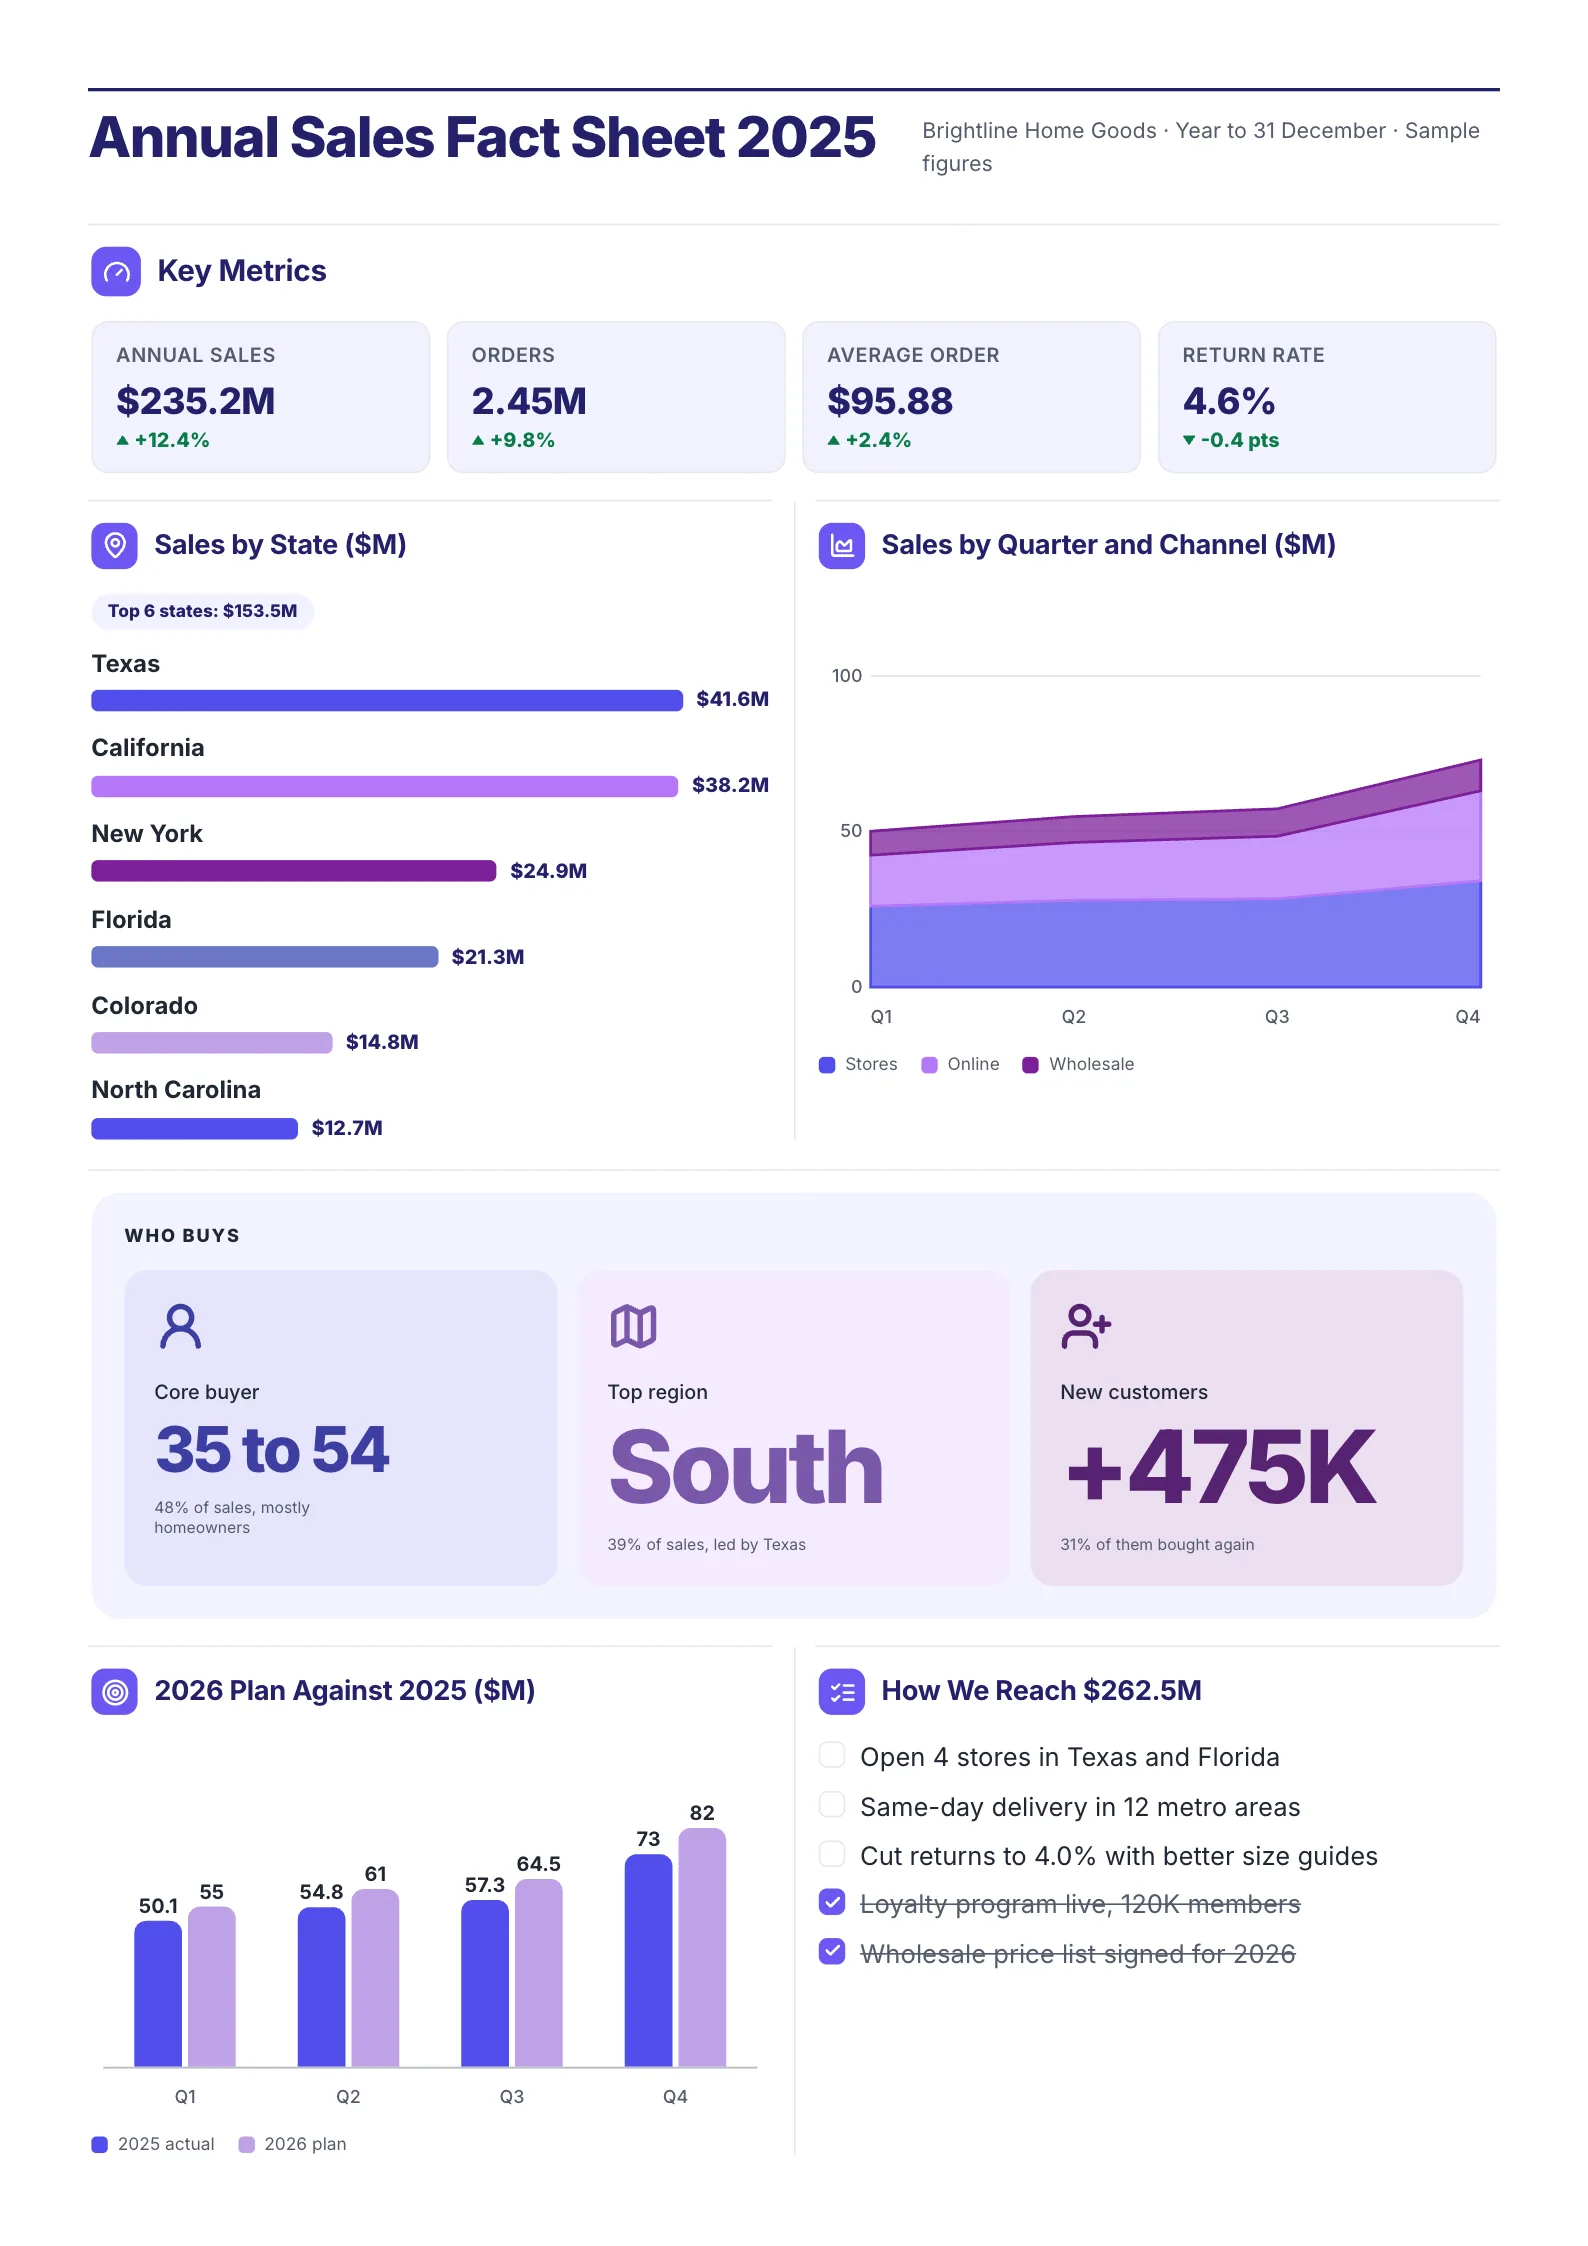 Annual Sales Fact SheetEdit for free(opens in a new tab)
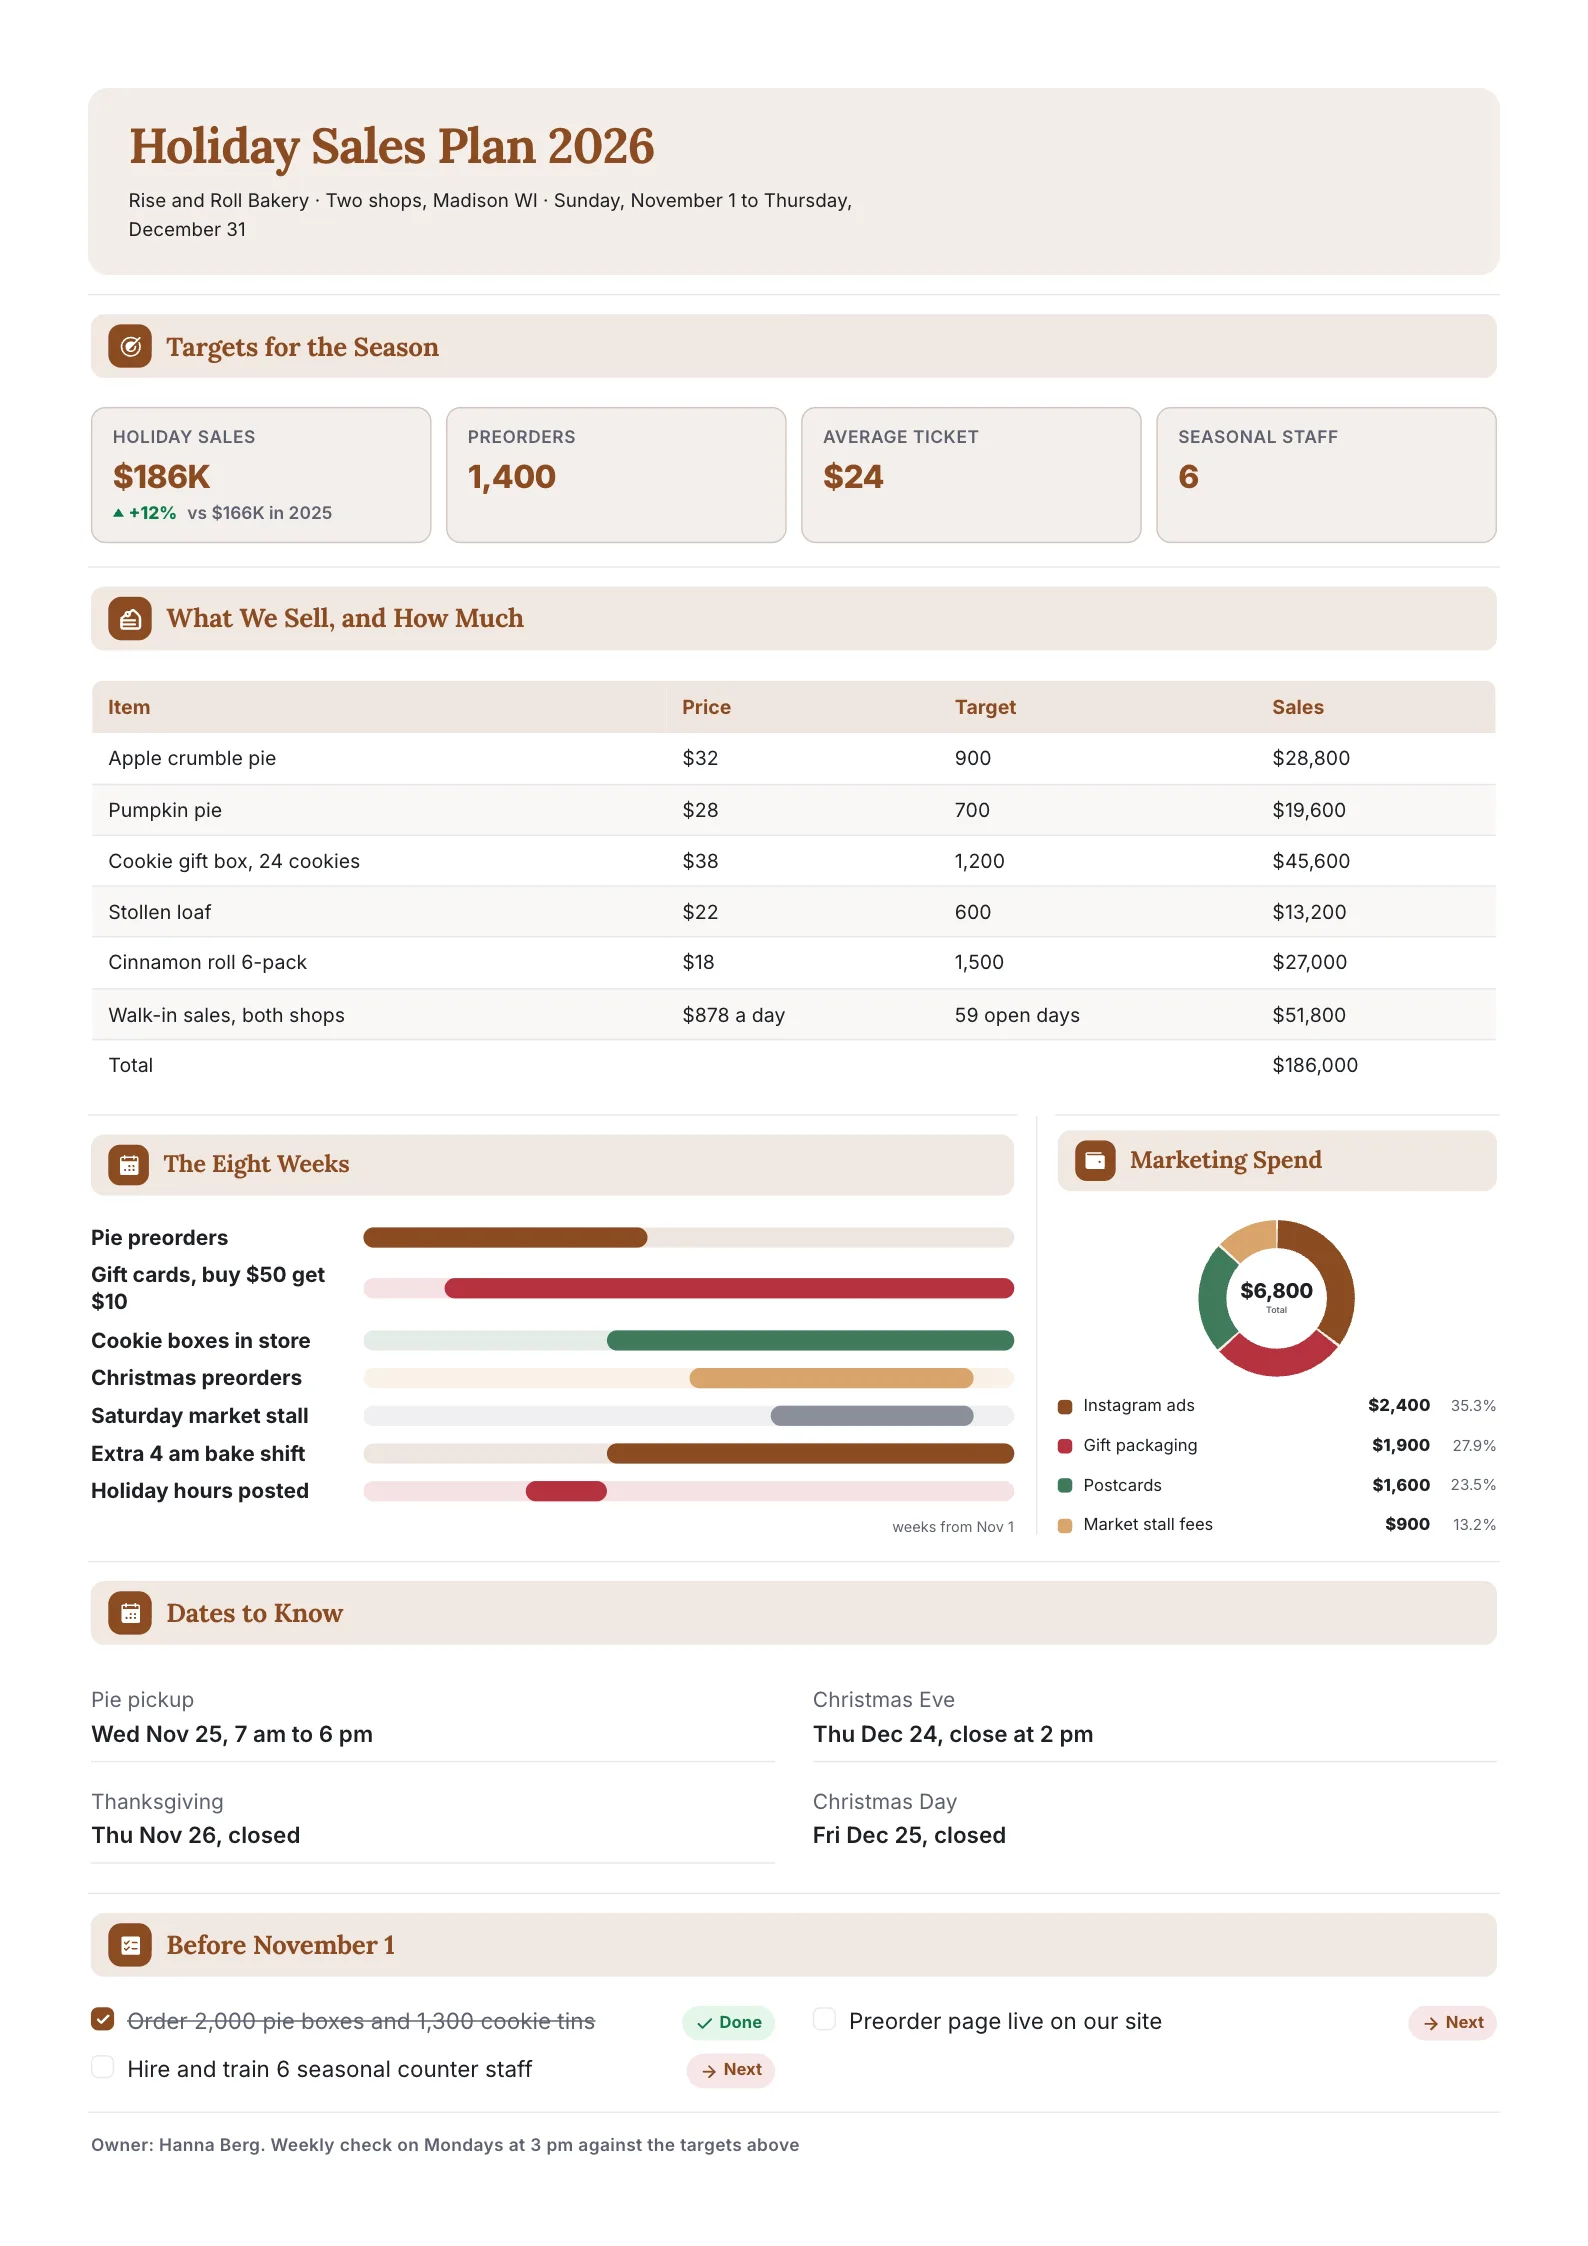 Holiday Sales PlanEdit for free(opens in a new tab)
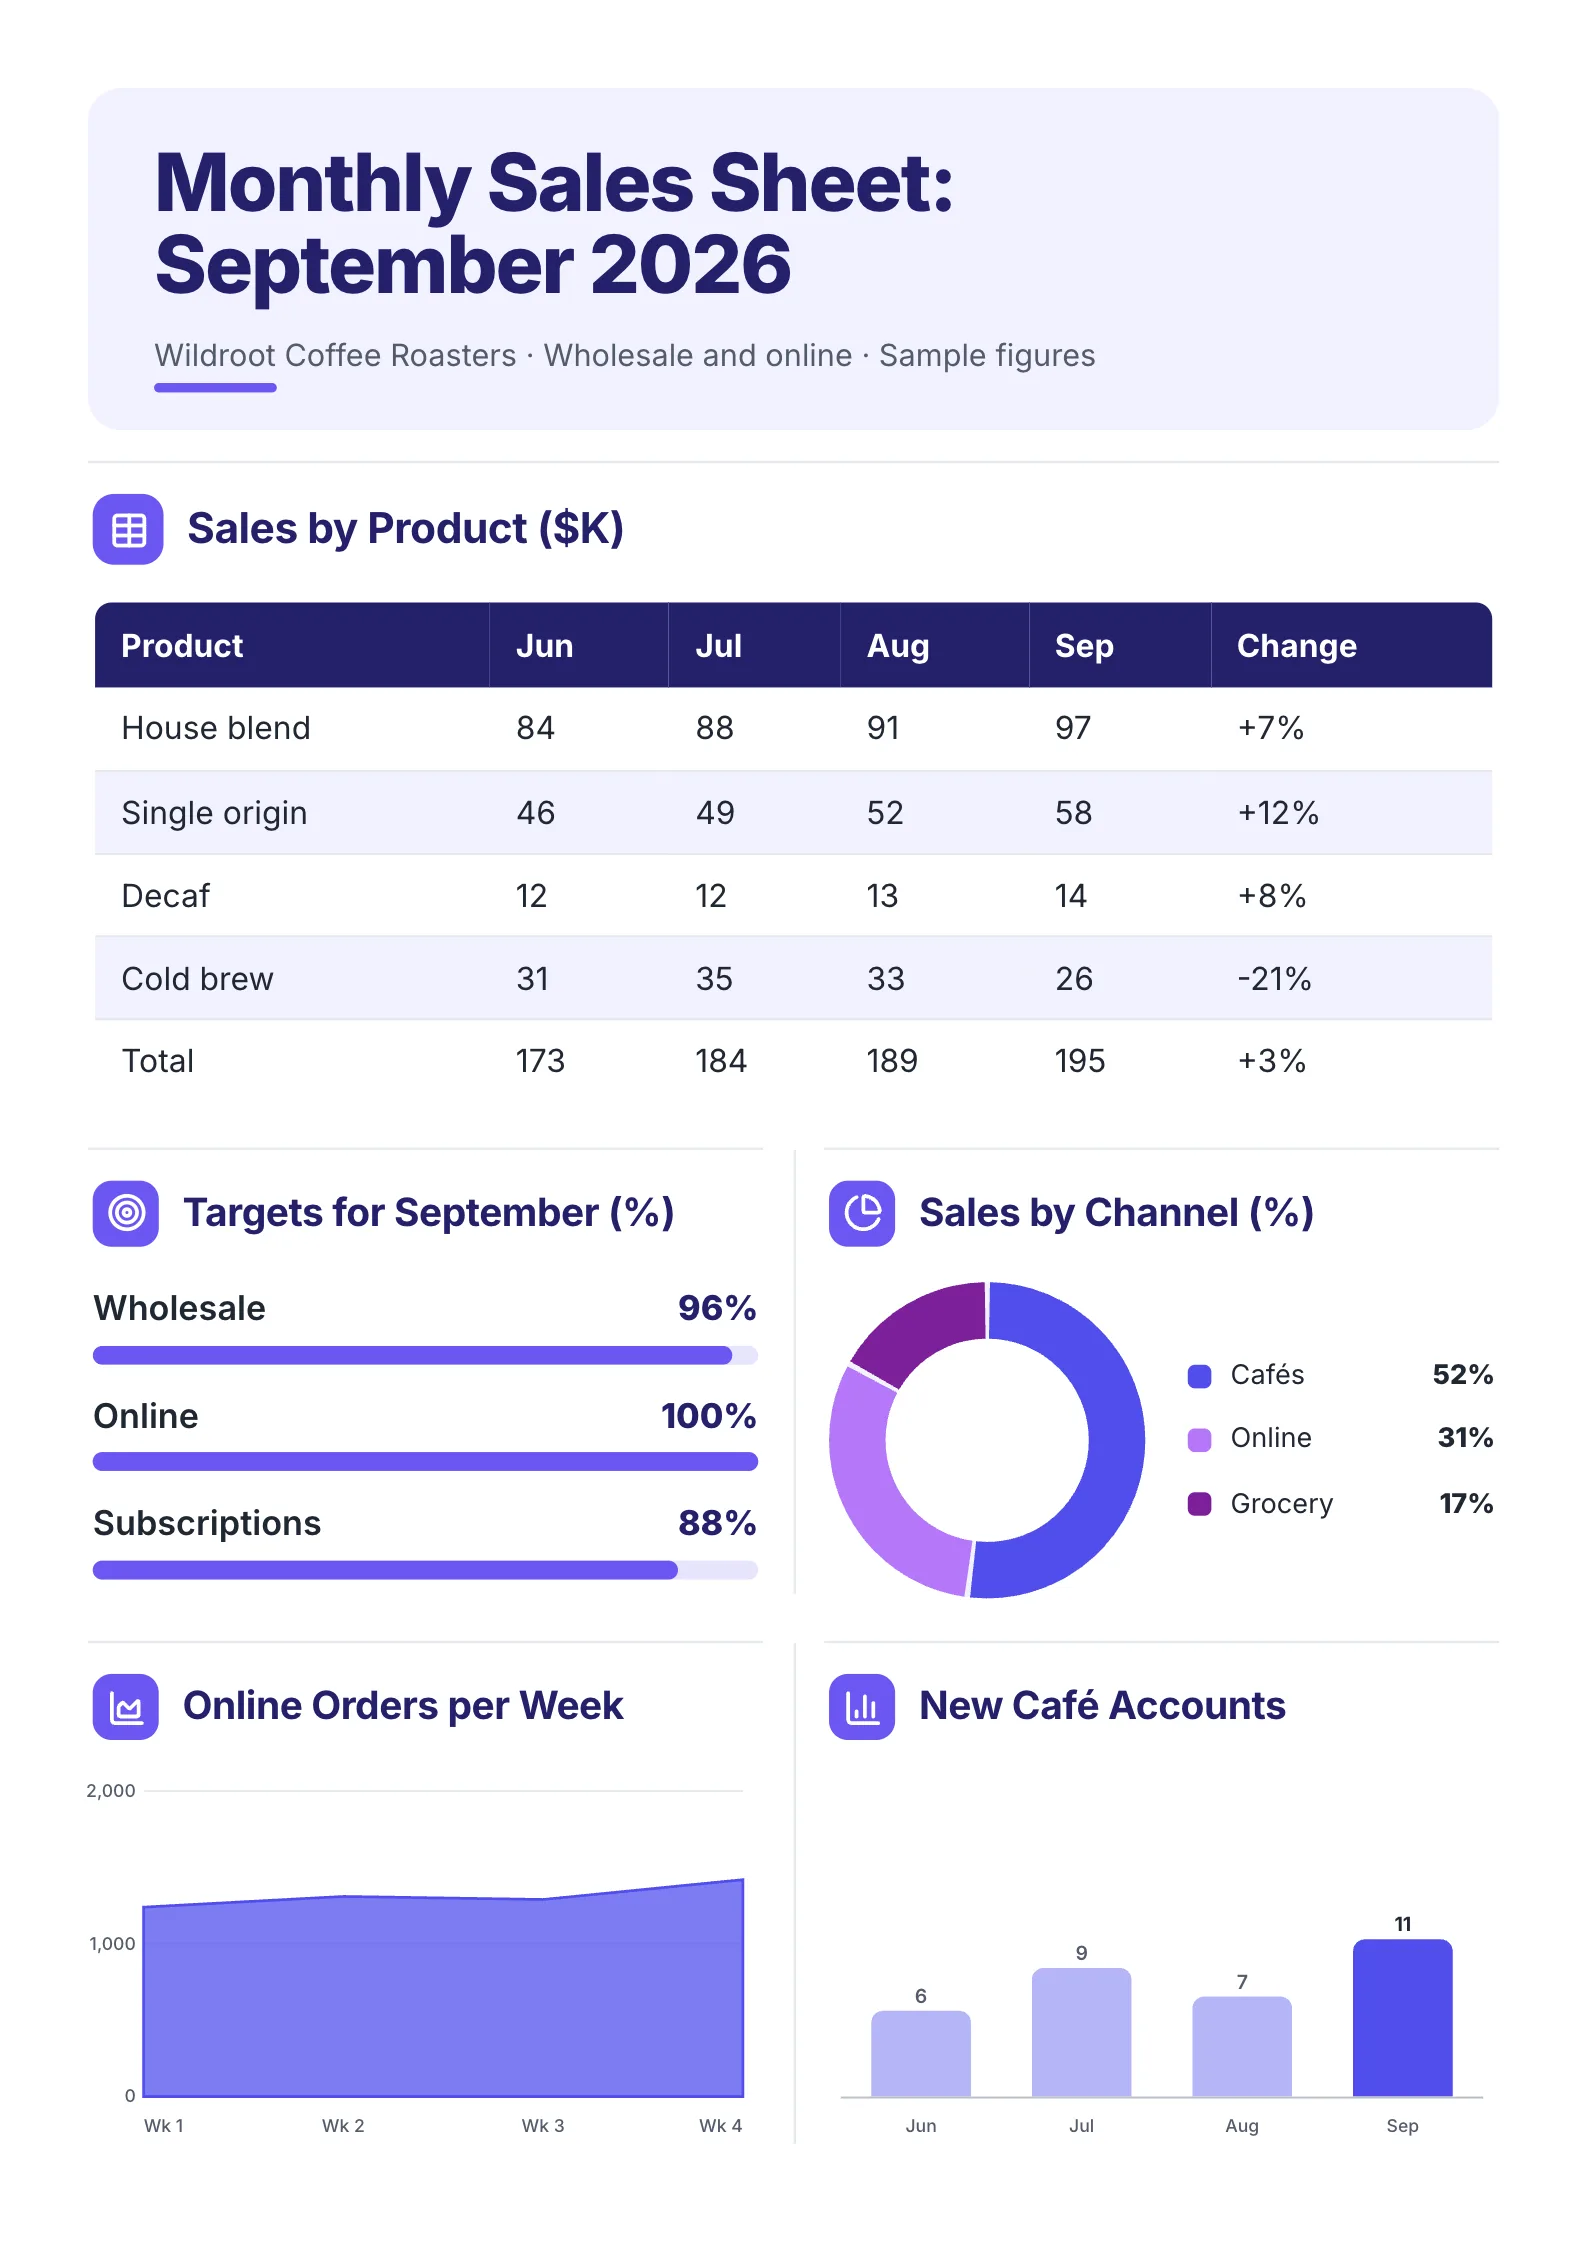 Monthly Sales SheetEdit for free(opens in a new tab)
Every example was made with MakeOnepagers. Each one opens as a template you can edit for free: every word, chart and color.
What is a sales forecast?
A sales forecast is an estimate of future sales for a set period, usually broken down by month, product, region or sales rep. It is different from a sales target or quota, which is what you want to sell, and from a sales plan, which says how you will get there. A healthy business keeps the three separate. When the forecast is quietly set equal to the target, nobody learns that the target is out of reach until the quarter is over.
3 ways to build a sales forecast
1. From history (top down) Take last period's sales and apply a growth rate based on recent trend and season. Simple and quick, and good for stable businesses with years of data. Weak when something has changed, such as a new product, a new rep or a new market.
2. From the pipeline (bottom up) List every open deal, put it in a stage, and multiply its value by the chance that deals at that stage close. Add them up. This is the most common method for businesses with a sales team, because it is built from real deals, not hopes.
3. From capacity or activity Work from what the team can do: reps × meetings a month × win rate × average deal size. Useful for a new team or a new market with no pipeline history yet.
The strongest forecasts use two methods and compare them. If the pipeline says $720,000 and history says $940,000, the gap is the conversation to have.
What a sales forecast should include
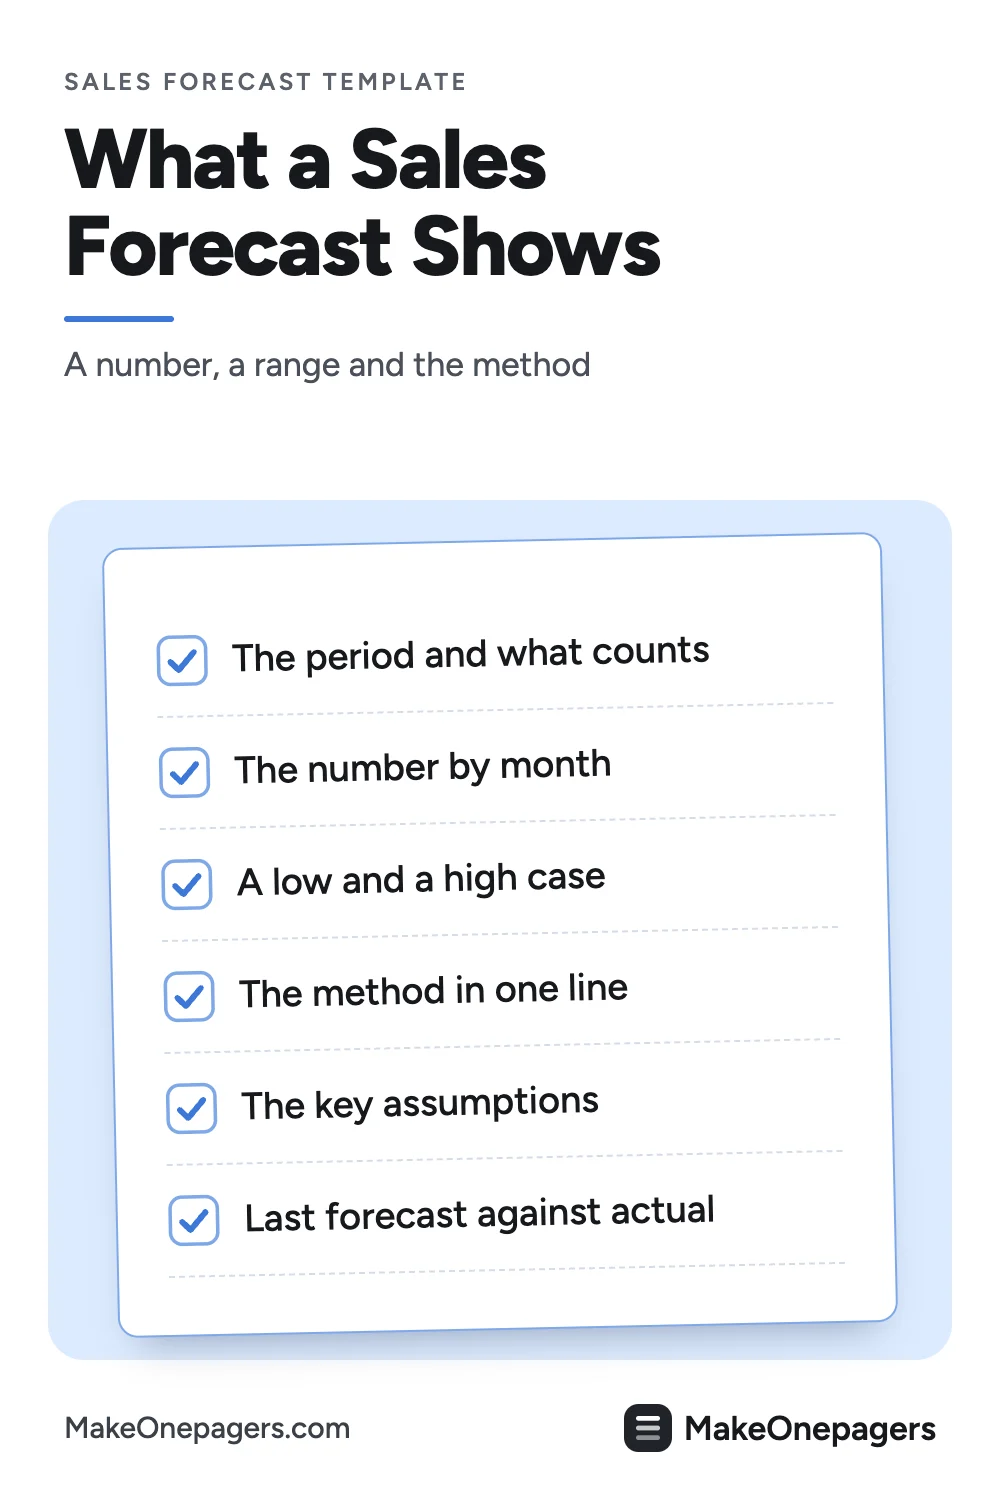
- The period and what is counted: orders, invoiced sales or cash received.
- The forecast number, by month or by product or region.
- A range: a low case and a high case beside the main number.
- The method, in one line.
- The key assumptions: win rates, average deal size, prices, new reps, seasonality.
- Accuracy: last period's forecast beside what actually happened.
- What would change it: the two or three deals or events that move the number most.
A free sales forecast template
Copy this into a document, or open one of the examples further down and edit it.
| Part | What to write, with an example |
|---|---|
| Title | Team and period. Q1 Sales Forecast, Commercial Team |
| Counted as | Signed orders |
| Forecast | $722,000, by month |
| Range | Low $614,000, high $840,000 |
| Method | Pipeline weighted by stage, checked against last year plus 12% |
| Assumptions | Win rates by stage, average deal size, no price change |
| Last forecast vs actual | Forecast $650,000, actual $684,000, 5% under |
| Swing deals | The two or three biggest open deals and their stage |
A worked example: a pipeline forecast for one quarter
The figures below are an example, made up for this guide so every step can be checked. Use your own pipeline and your own win rates, measured from past deals.
A commercial sales team has $1,900,000 of open deals that could close next quarter. It weights each stage by the share of deals at that stage that have closed in the past year:
| Stage | Open deals | Win rate at this stage | Weighted |
|---|---|---|---|
| Qualified | $800,000 | 15% | $120,000 |
| Proposal sent | $600,000 | 40% | $240,000 |
| Negotiation | $350,000 | 70% | $245,000 |
| Verbal yes | $150,000 | 78% | $117,000 |
| Total | $1,900,000 | $722,000 |
The forecast is $722,000. Only 38% of the open pipeline is expected to close, which is why a forecast built from the raw pipeline would be badly wrong.
A second method as a check. The same quarter last year closed $645,000, and the business has grown about 12% a year. $645,000 × 1.12 = $722,400. The two methods agree closely, which raises confidence.
The range. If win rates at each stage come in 15% lower, the forecast is about $614,000. If two large proposals close early, about $840,000. Leadership plans hiring and stock on the main number and keeps a buffer for the low case.
Accuracy. Last quarter's forecast was $650,000 and the team closed $684,000, so the forecast was 5% under. Writing that down every quarter shows whether the team tends to be optimistic or cautious, and by how much.
A sales plan built on the forecast
 Edit this template
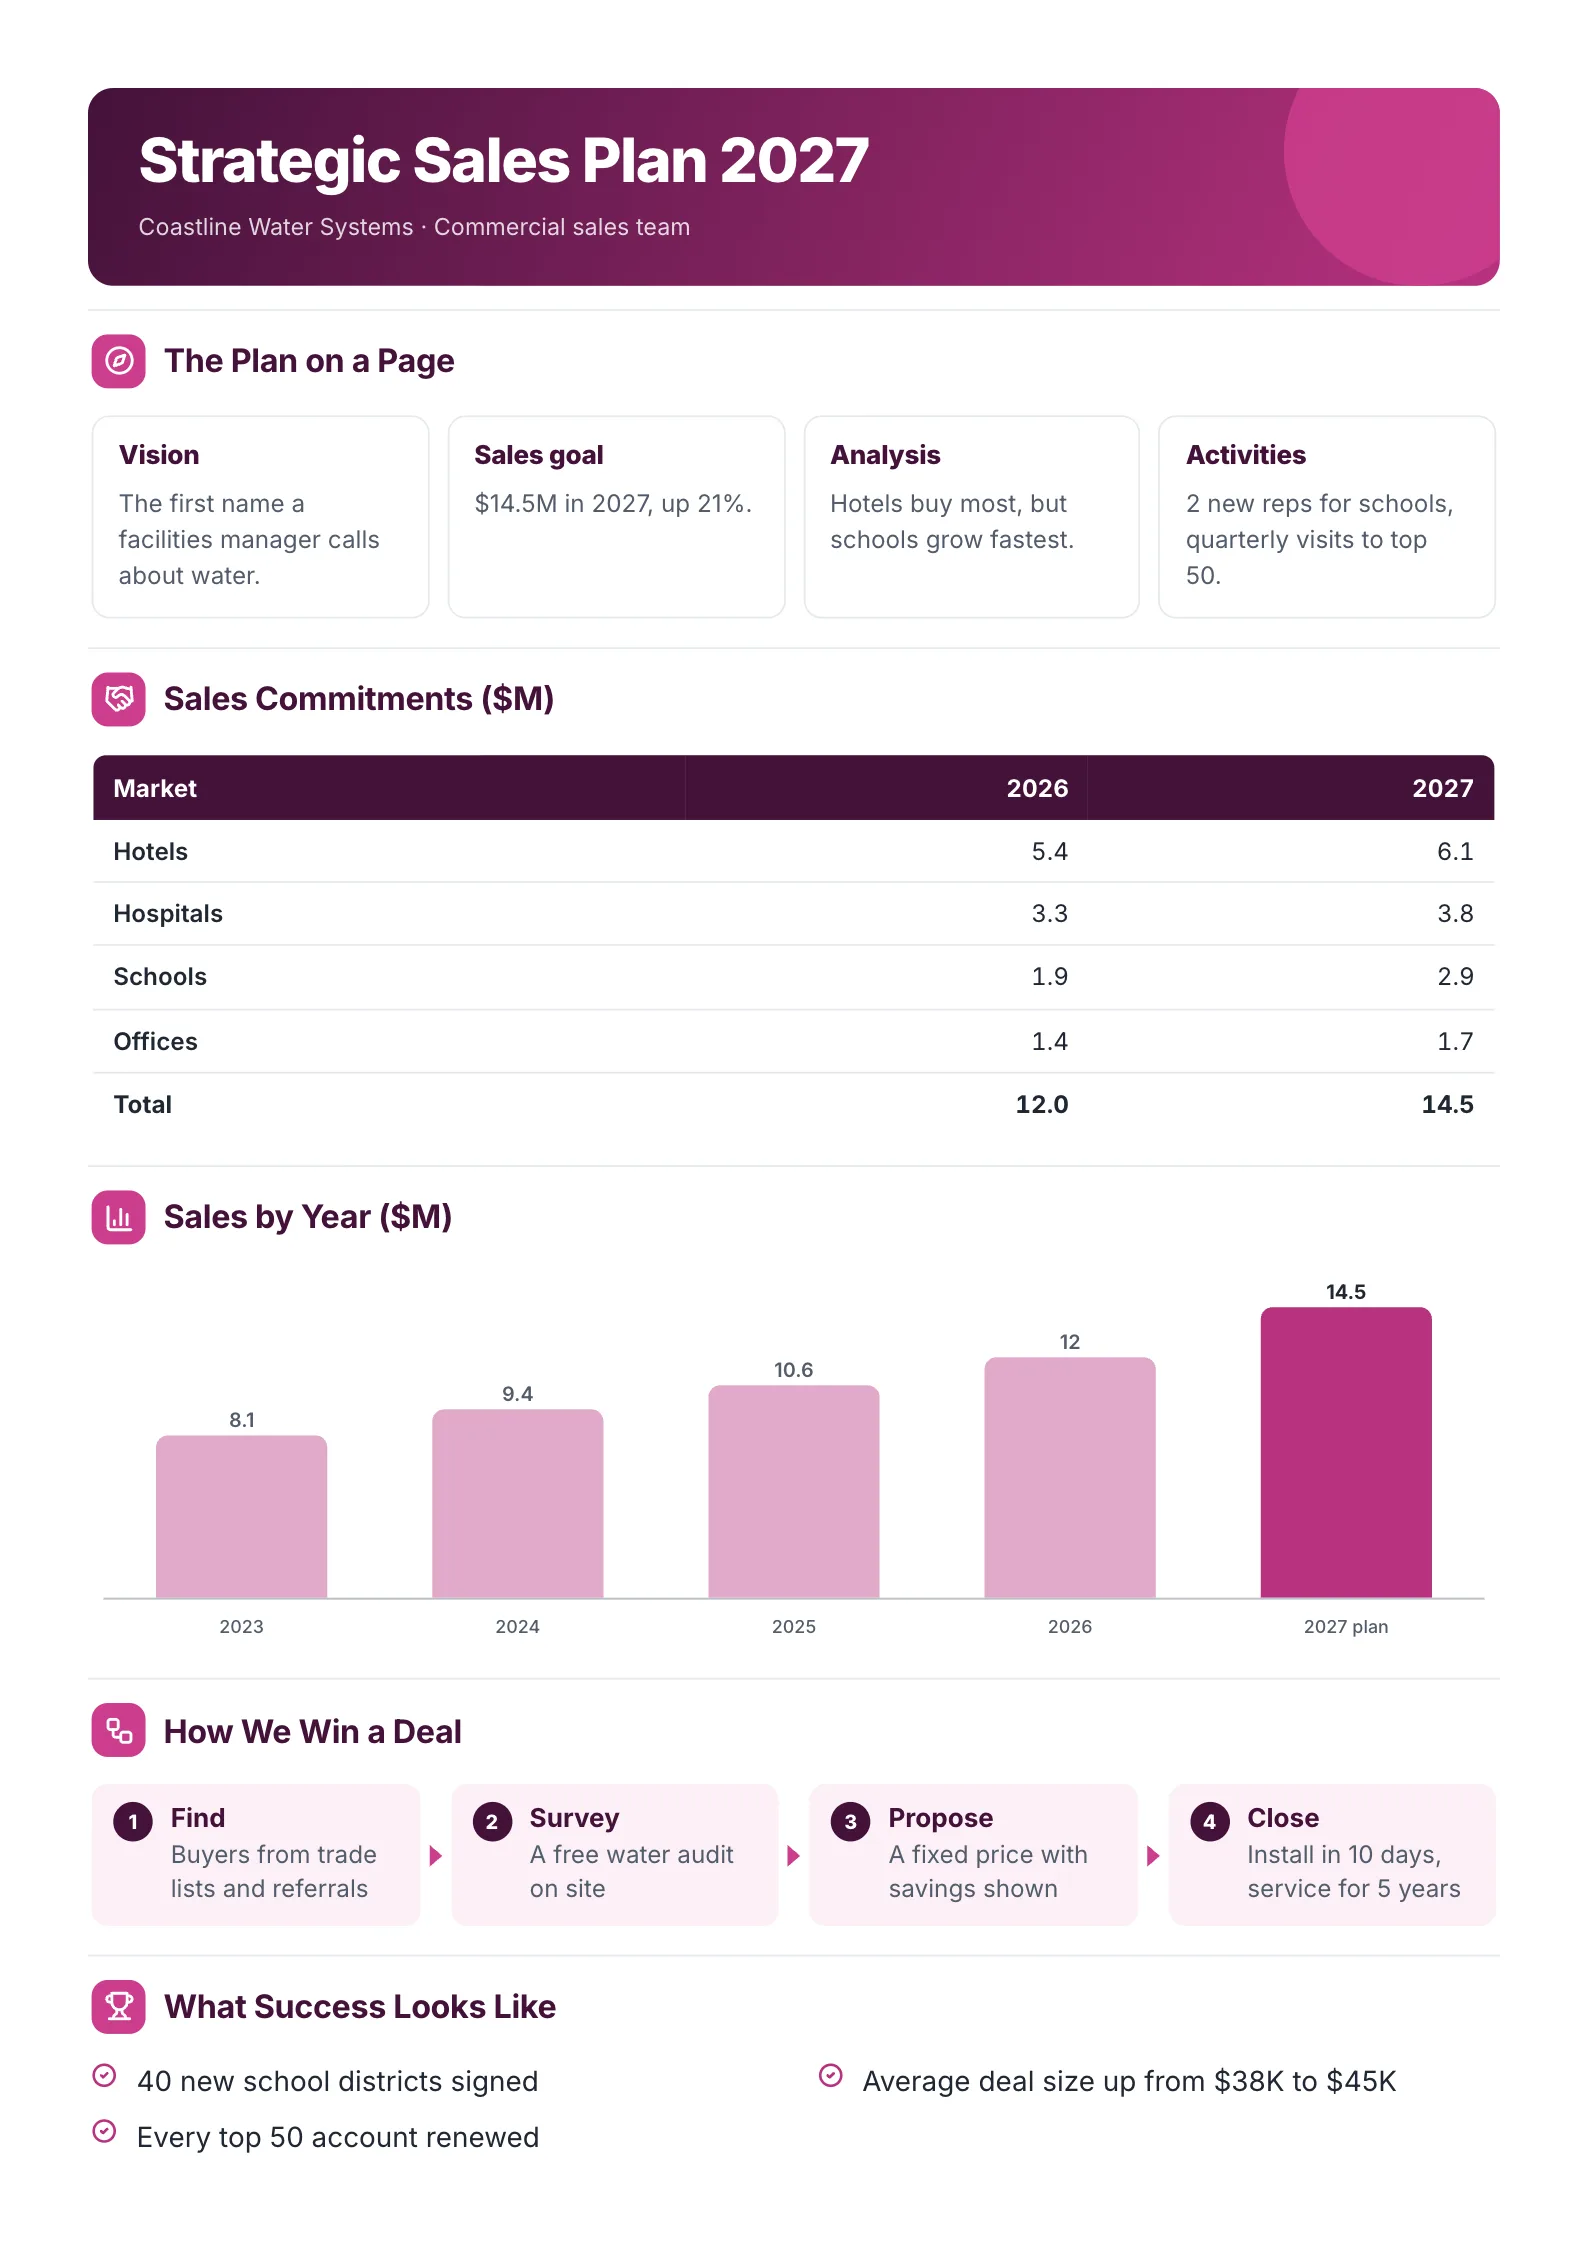
A sample company. The forecast by market sits at the centre of the plan, and the steps and goals below it say how the team will reach it.
What to copy:
- Sales by market for this year and next, adding up to the total. A forecast split this way shows where growth is expected: here schools grow from $1.9M to $2.9M.
- Sales by year as bars, so the new number sits in context: $12.0M in 2026 to $14.5M planned for 2027, up 21%.
- What success looks like, in measures the team can track during the year.
Edit for free: strategic sales plan template.
Other sales forecast examples
- Sales tracking sheet: actual sales by product and month, the numbers your next forecast is built from.
- Pipeline briefing: the open deals by stage that a pipeline forecast weights.
- Weekly store sales: sales against forecast for each store, every week.
Sales forecast in a spreadsheet or on one page?
Searches for this template often add "excel" or "google sheets", and a spreadsheet or your CRM is the right place to build the forecast. The people who use it, though, need the answer: the number, the range, the method and the swing deals. Put that on one page for the forecast meeting. If your forecast already exists as a CRM export or a slide deck, the free AI One-Pager generator reads a PDF, Word or PowerPoint file and gives it back as a designed One-Pager. Check every figure against the source before you share it.
How to make a sales forecast in 6 steps
- Choose the period and what counts as a sale.
- Pull the open pipeline by stage, or last year's sales by month.
- Apply measured win rates, or a growth rate based on recent trend.
- Check with a second method and explain any gap.
- Add a low and high case and the assumptions behind them.
- Record last period's forecast against actual, every time.
Sales forecast mistakes
- Forecast equals target. If the forecast always matches the quota, it is not a forecast.
- Win rates from hope. Use the share of deals that actually closed at each stage over the past year.
- Old deals left in the pipeline. A deal that has not moved in 90 days inflates every stage.
- One number, no range. Plans need to know how bad the low case could be.
- No accuracy check. Without last forecast against actual, the team never learns how far to trust it.
Make your sales forecast
Open the free strategic sales plan template and put in your own markets and years, or drop your CRM export into the free AI One-Pager generator and get a finished one-page forecast back.
Frequently asked questions
What should a sales forecast include?
The period, the forecast number by month or segment, a low and high range, the method, the key assumptions, the last forecast against actual sales and the deals or events that would change it most.
How do you calculate a sales forecast?
The most common way is to multiply each open deal by the win rate for its stage and add them up. Another is to apply a growth rate to last year's sales for the same period. Using both and comparing them is more reliable than either alone.
What is the difference between a sales forecast and a sales target?
A forecast is what you expect to sell based on evidence. A target is what you want to sell. Keeping them apart shows early when a target is out of reach.
How often should a sales forecast be updated?
Weekly or every two weeks for the current quarter, and monthly for the rest of the year.