BlogGuide
KPI Report Template: Free One-Page KPI Report With 5 Examples
A free one-page KPI report template, the 6 parts every KPI report needs, a worked monthly example for a plant and the mistakes that bury what matters.

By MakeOnepagers Team
Updated · 10 min read
A KPI report template gives a team one page that shows how the business is doing against the few numbers that matter most. KPI stands for key performance indicator: a measure tied to a goal, with a target. A good KPI report is short on purpose. It shows four to six KPIs, each against its target, how each moved since last period, why the misses happened and what will be done about them. Below are the six parts every KPI report needs, a free KPI report template you can copy, a worked monthly example, five more KPI report examples and the mistakes that turn a KPI report into a wall of numbers nobody acts on.
One‑Pager examples
Real One-Pagers made with MakeOnepagers. Open any one to edit it as your own.
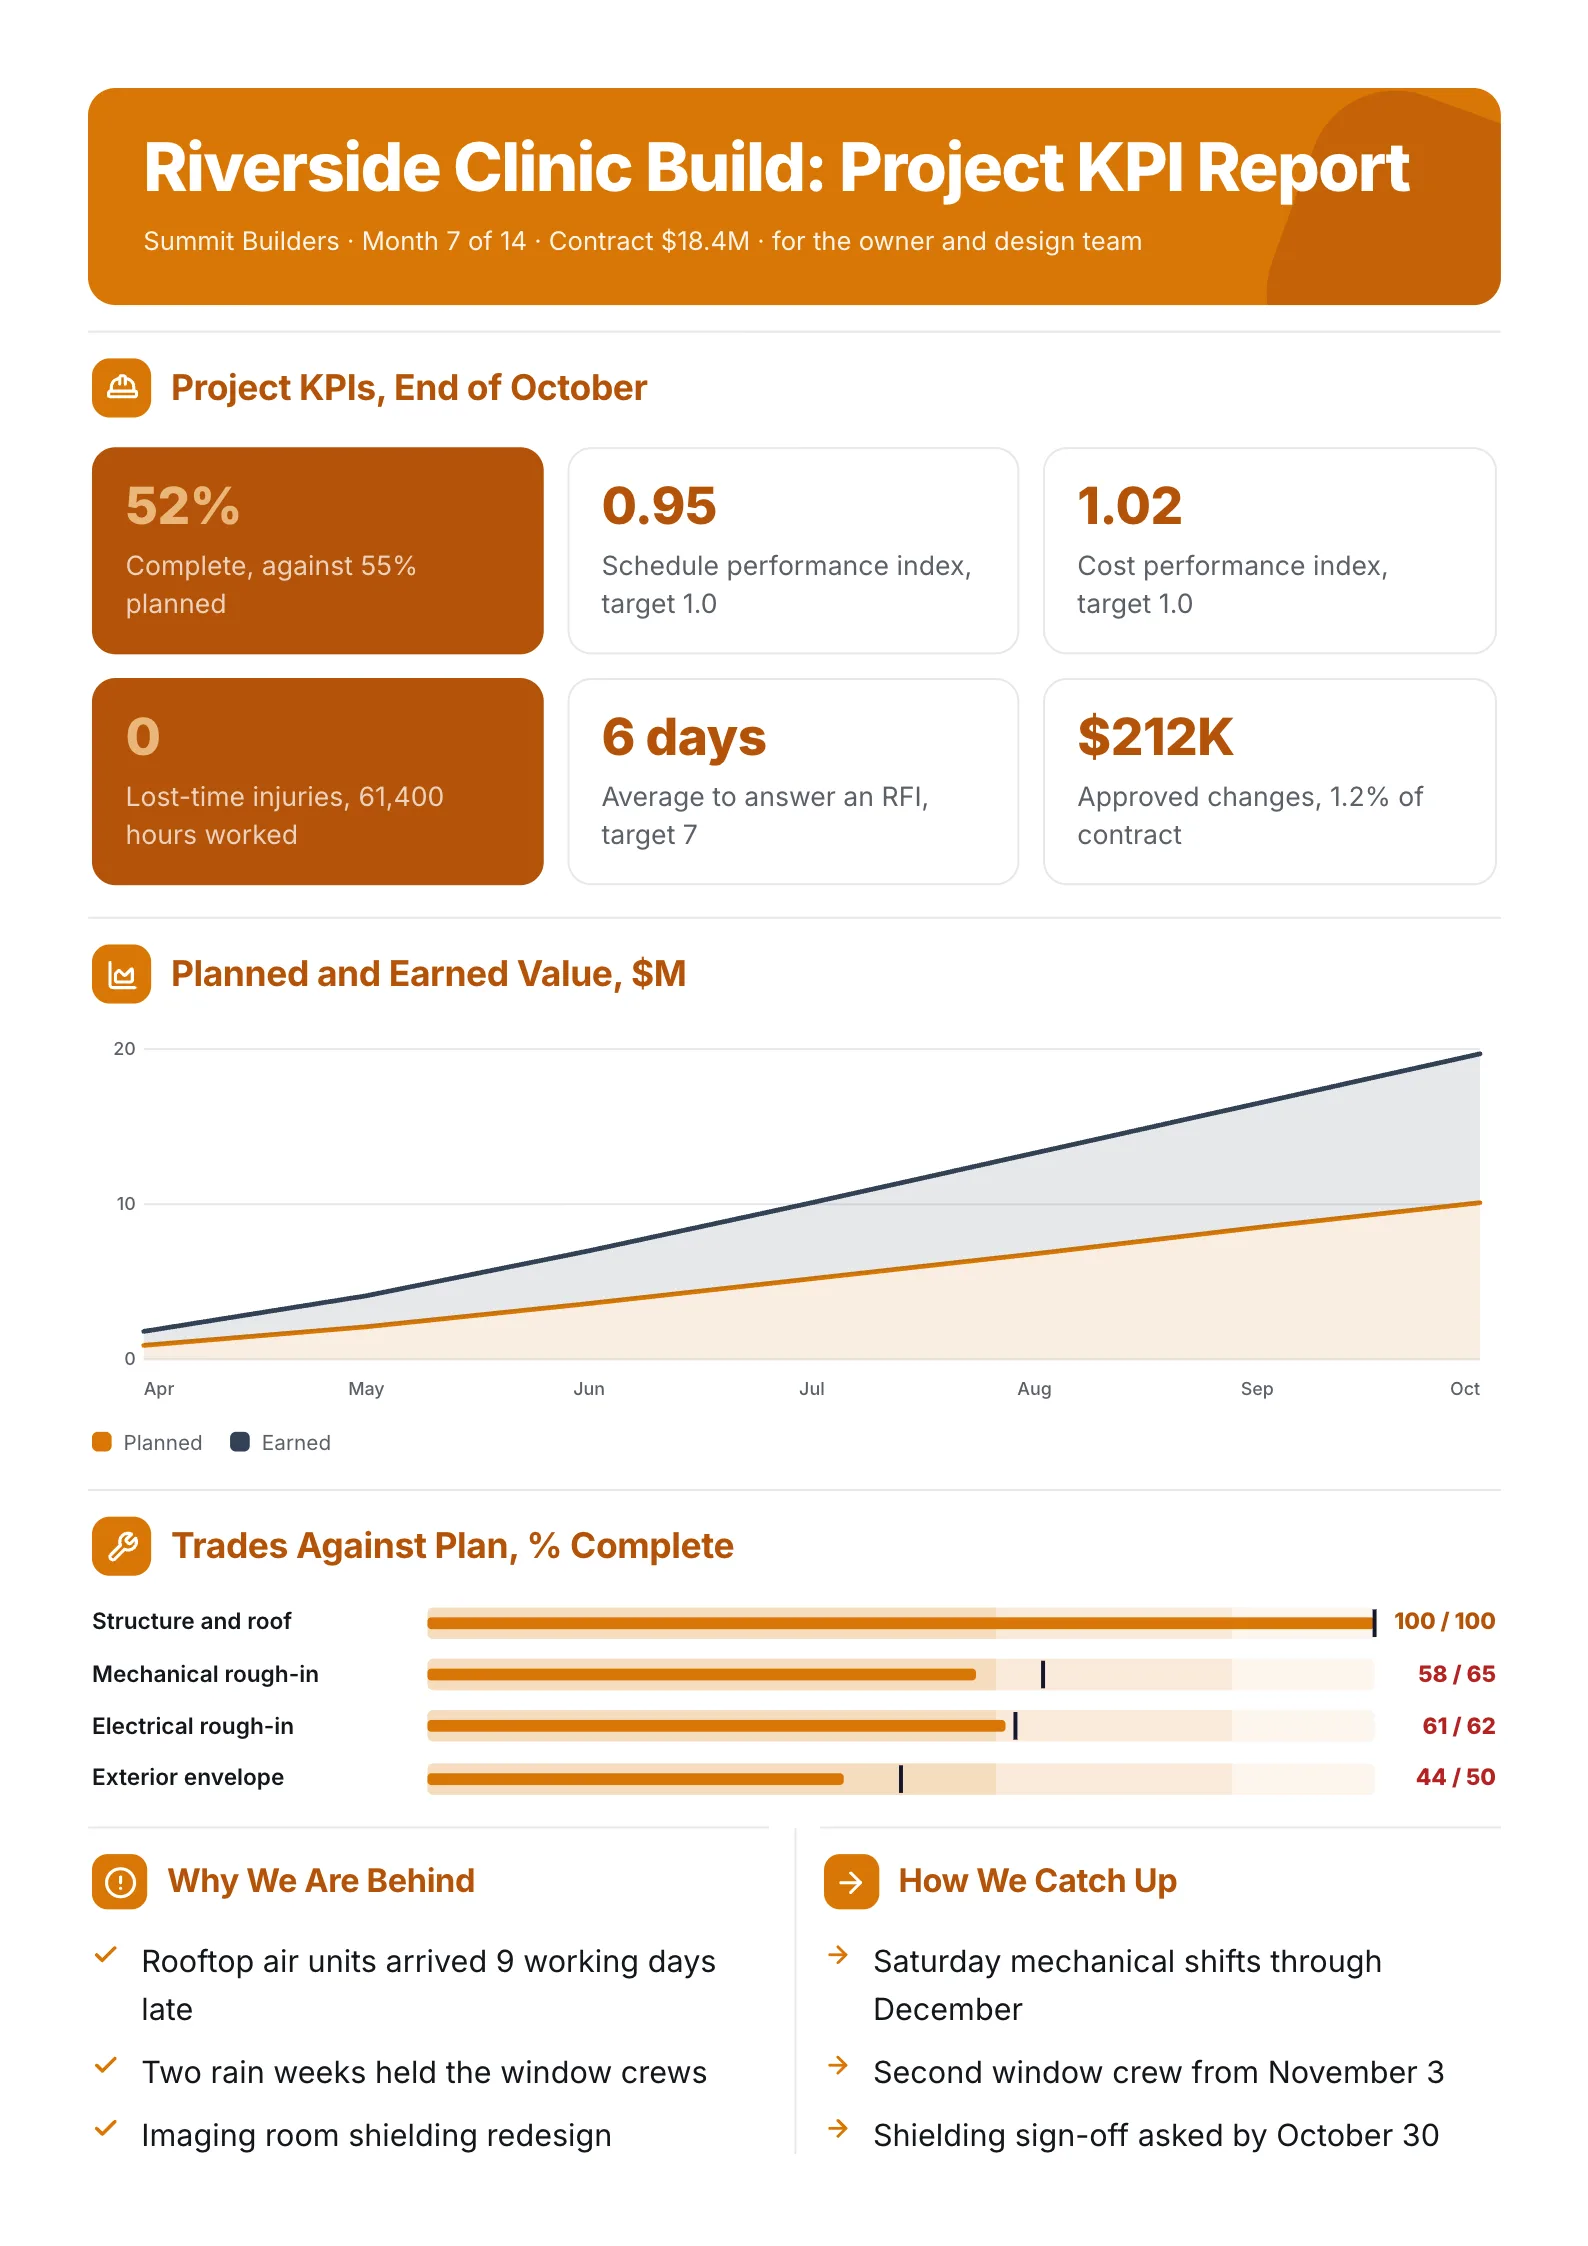 KPI Report: Construction ProjectEdit for free(opens in a new tab)
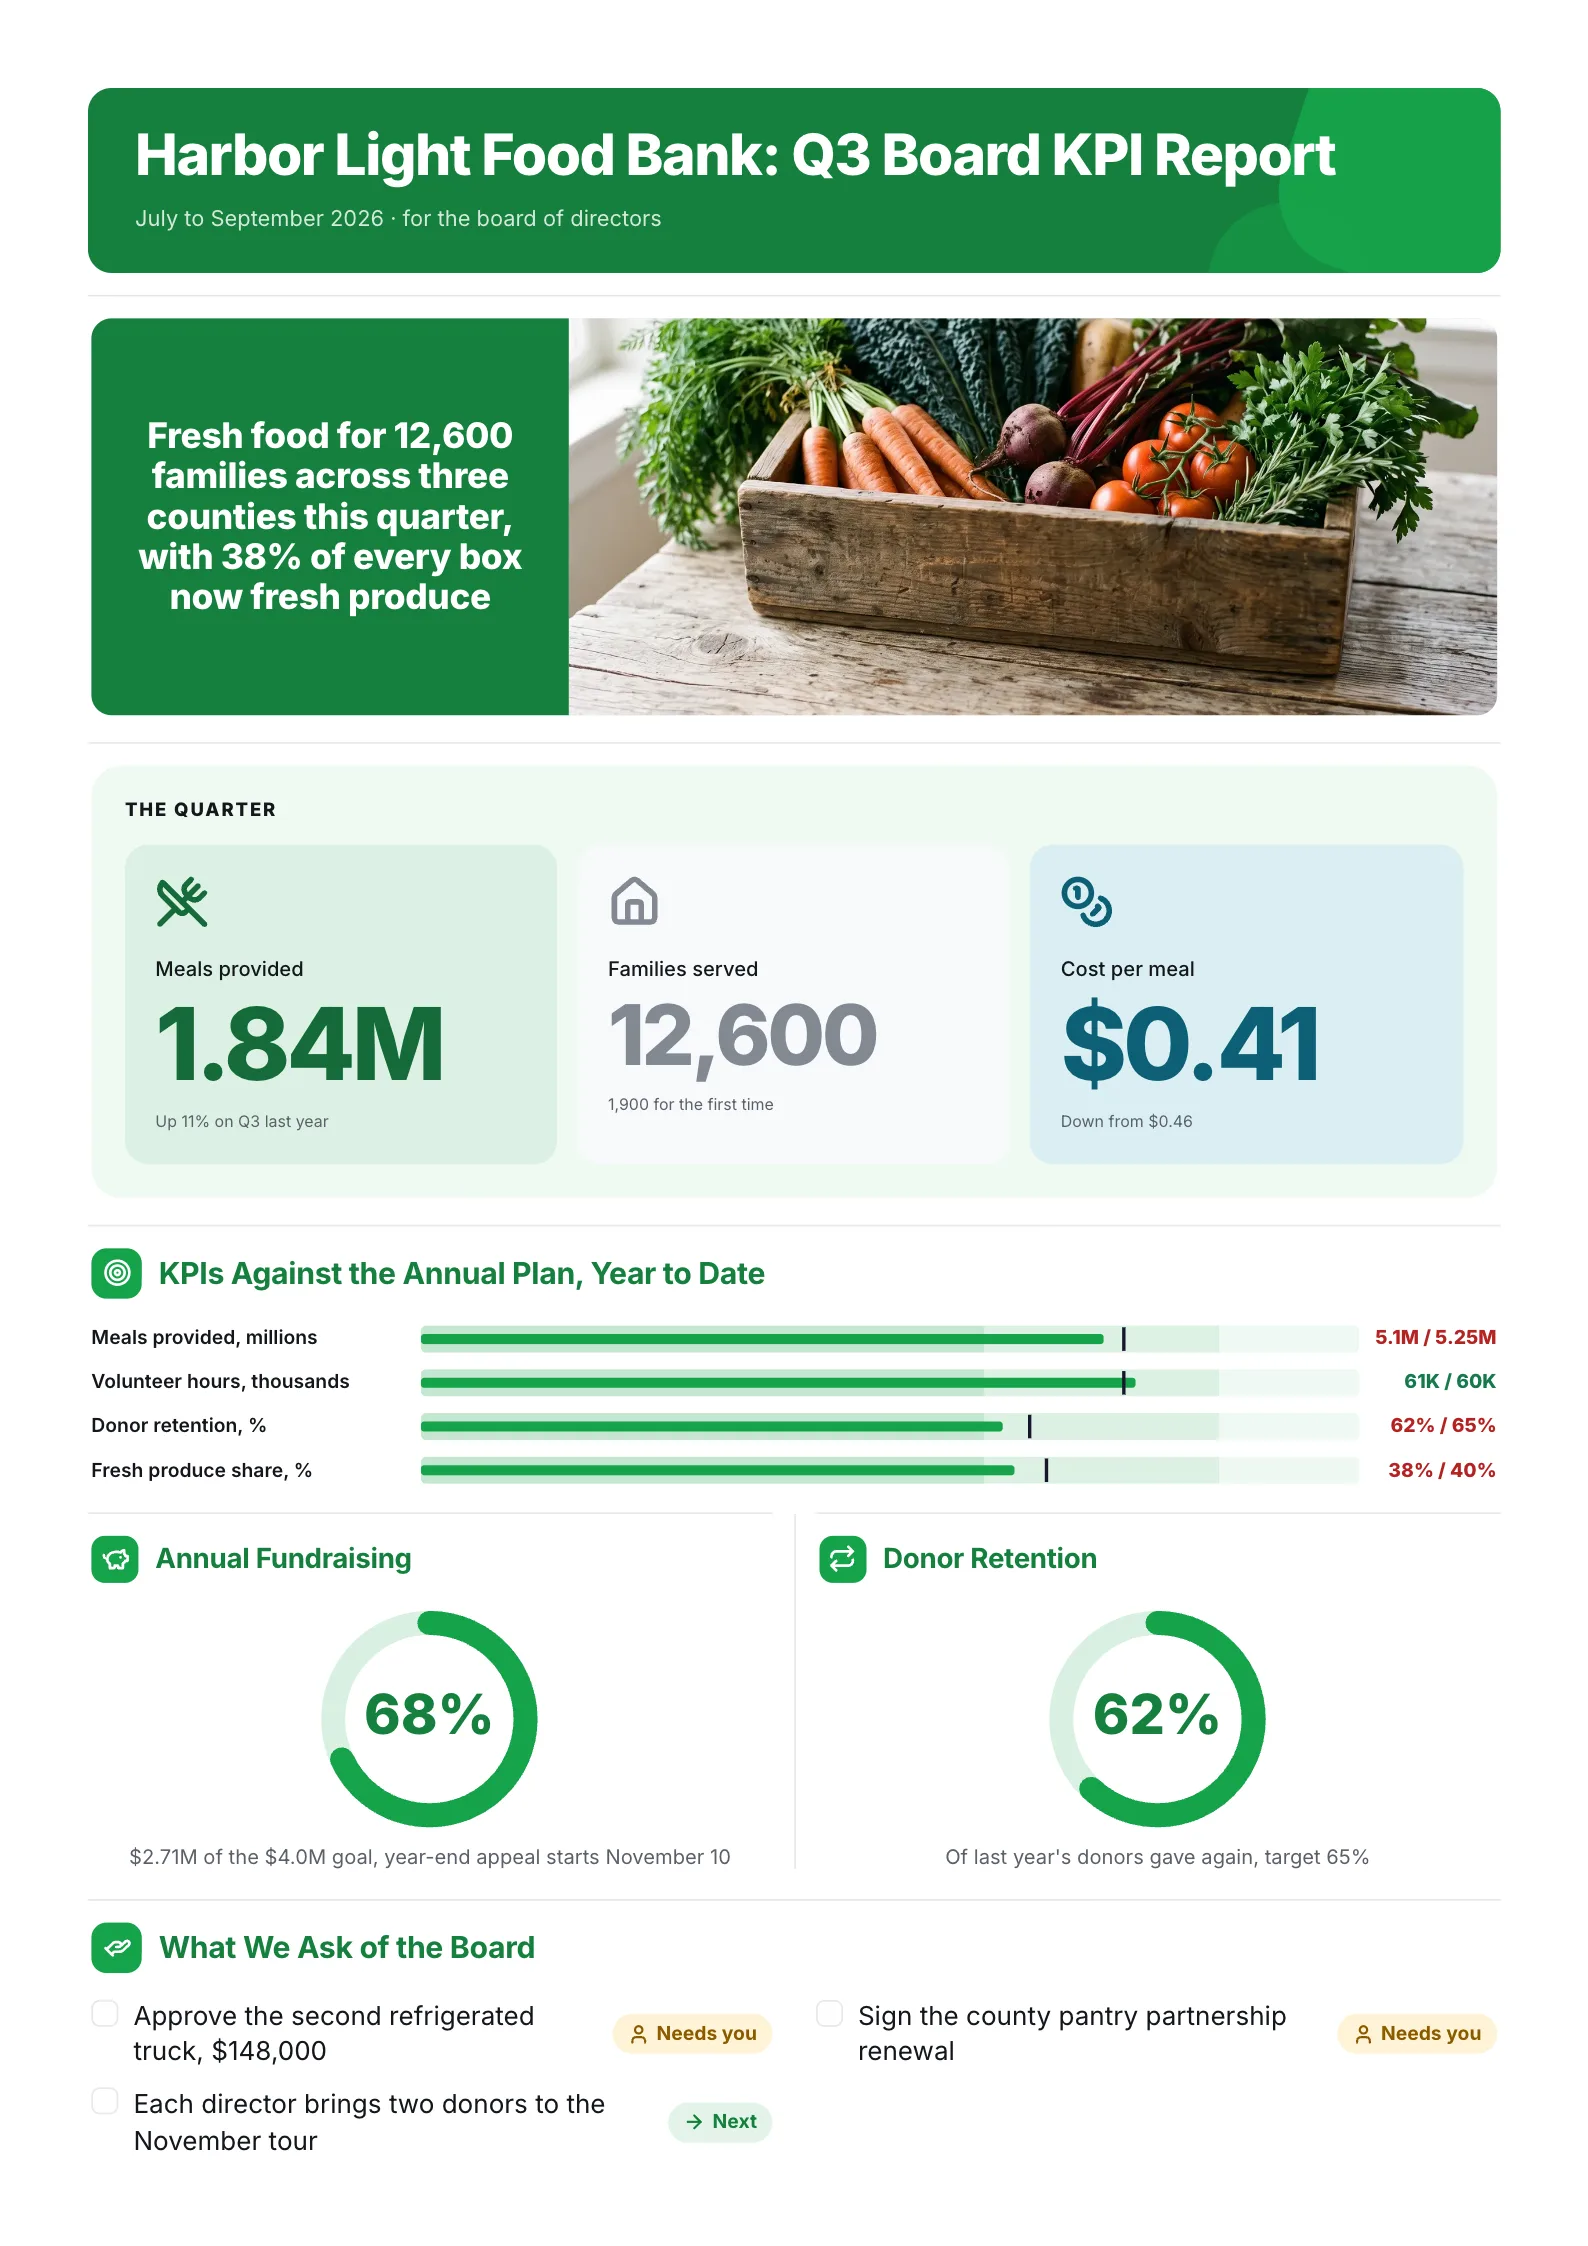 KPI Report: Nonprofit Board QuarterlyEdit for free(opens in a new tab)
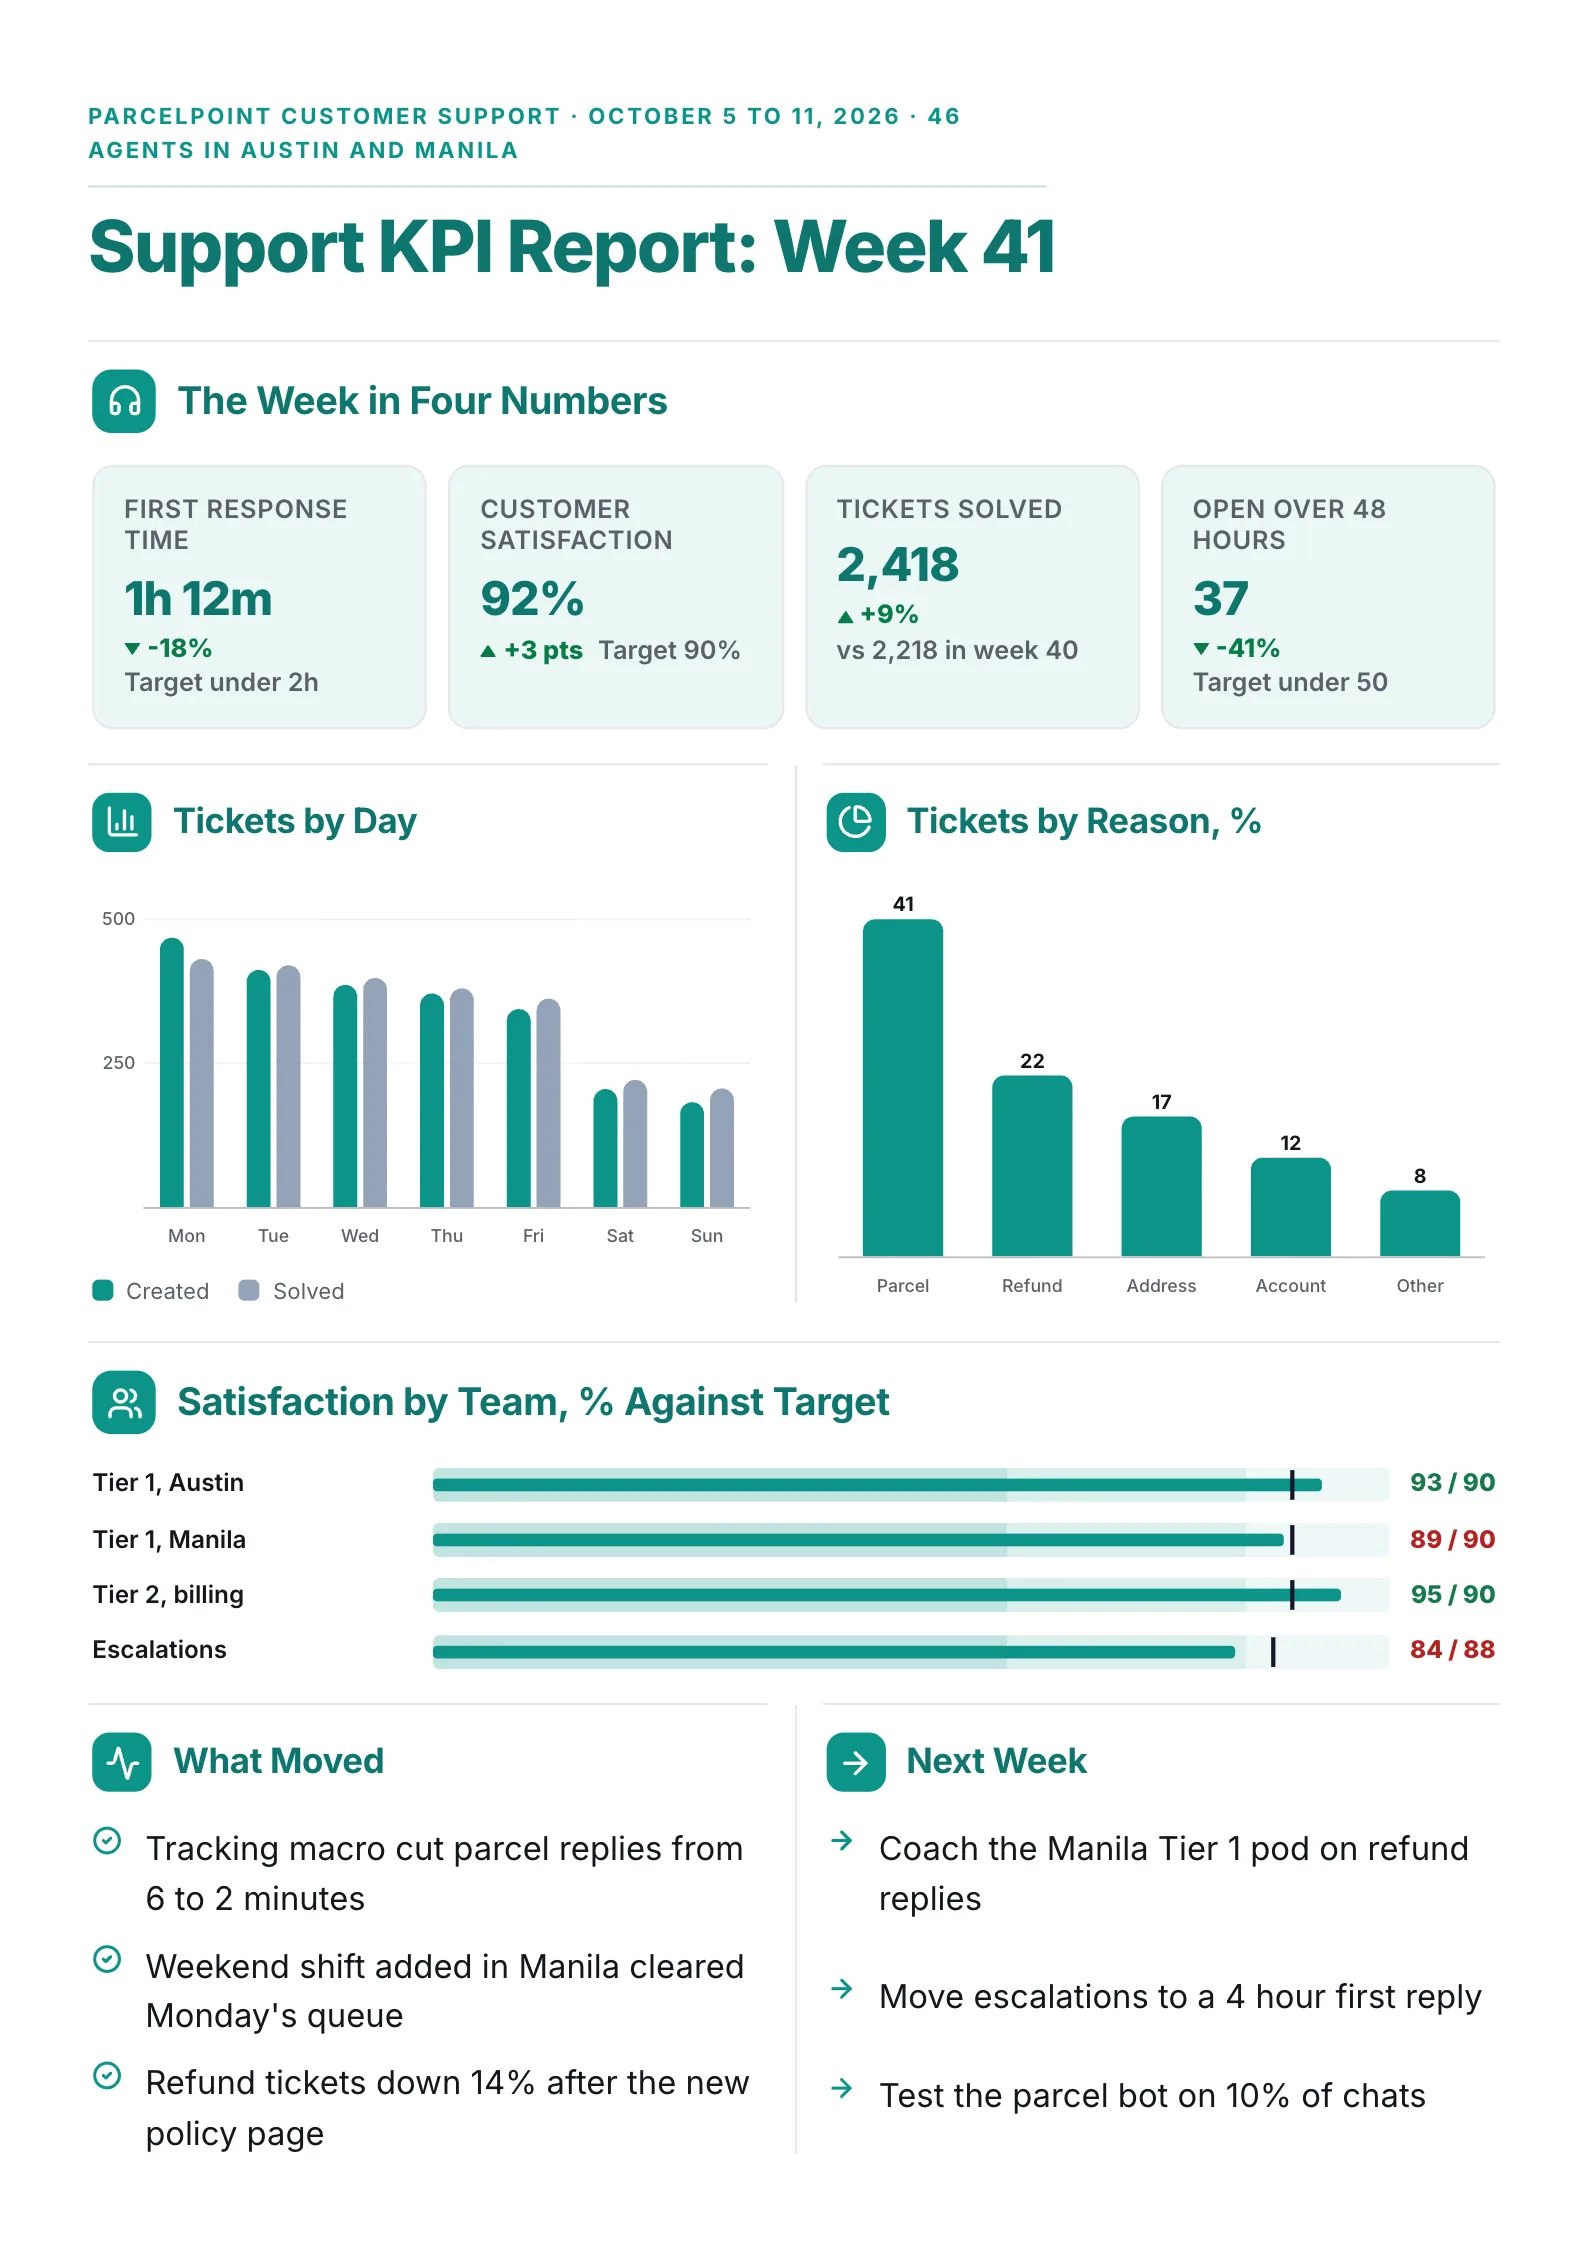 KPI Report: Customer Support WeeklyEdit for free(opens in a new tab)
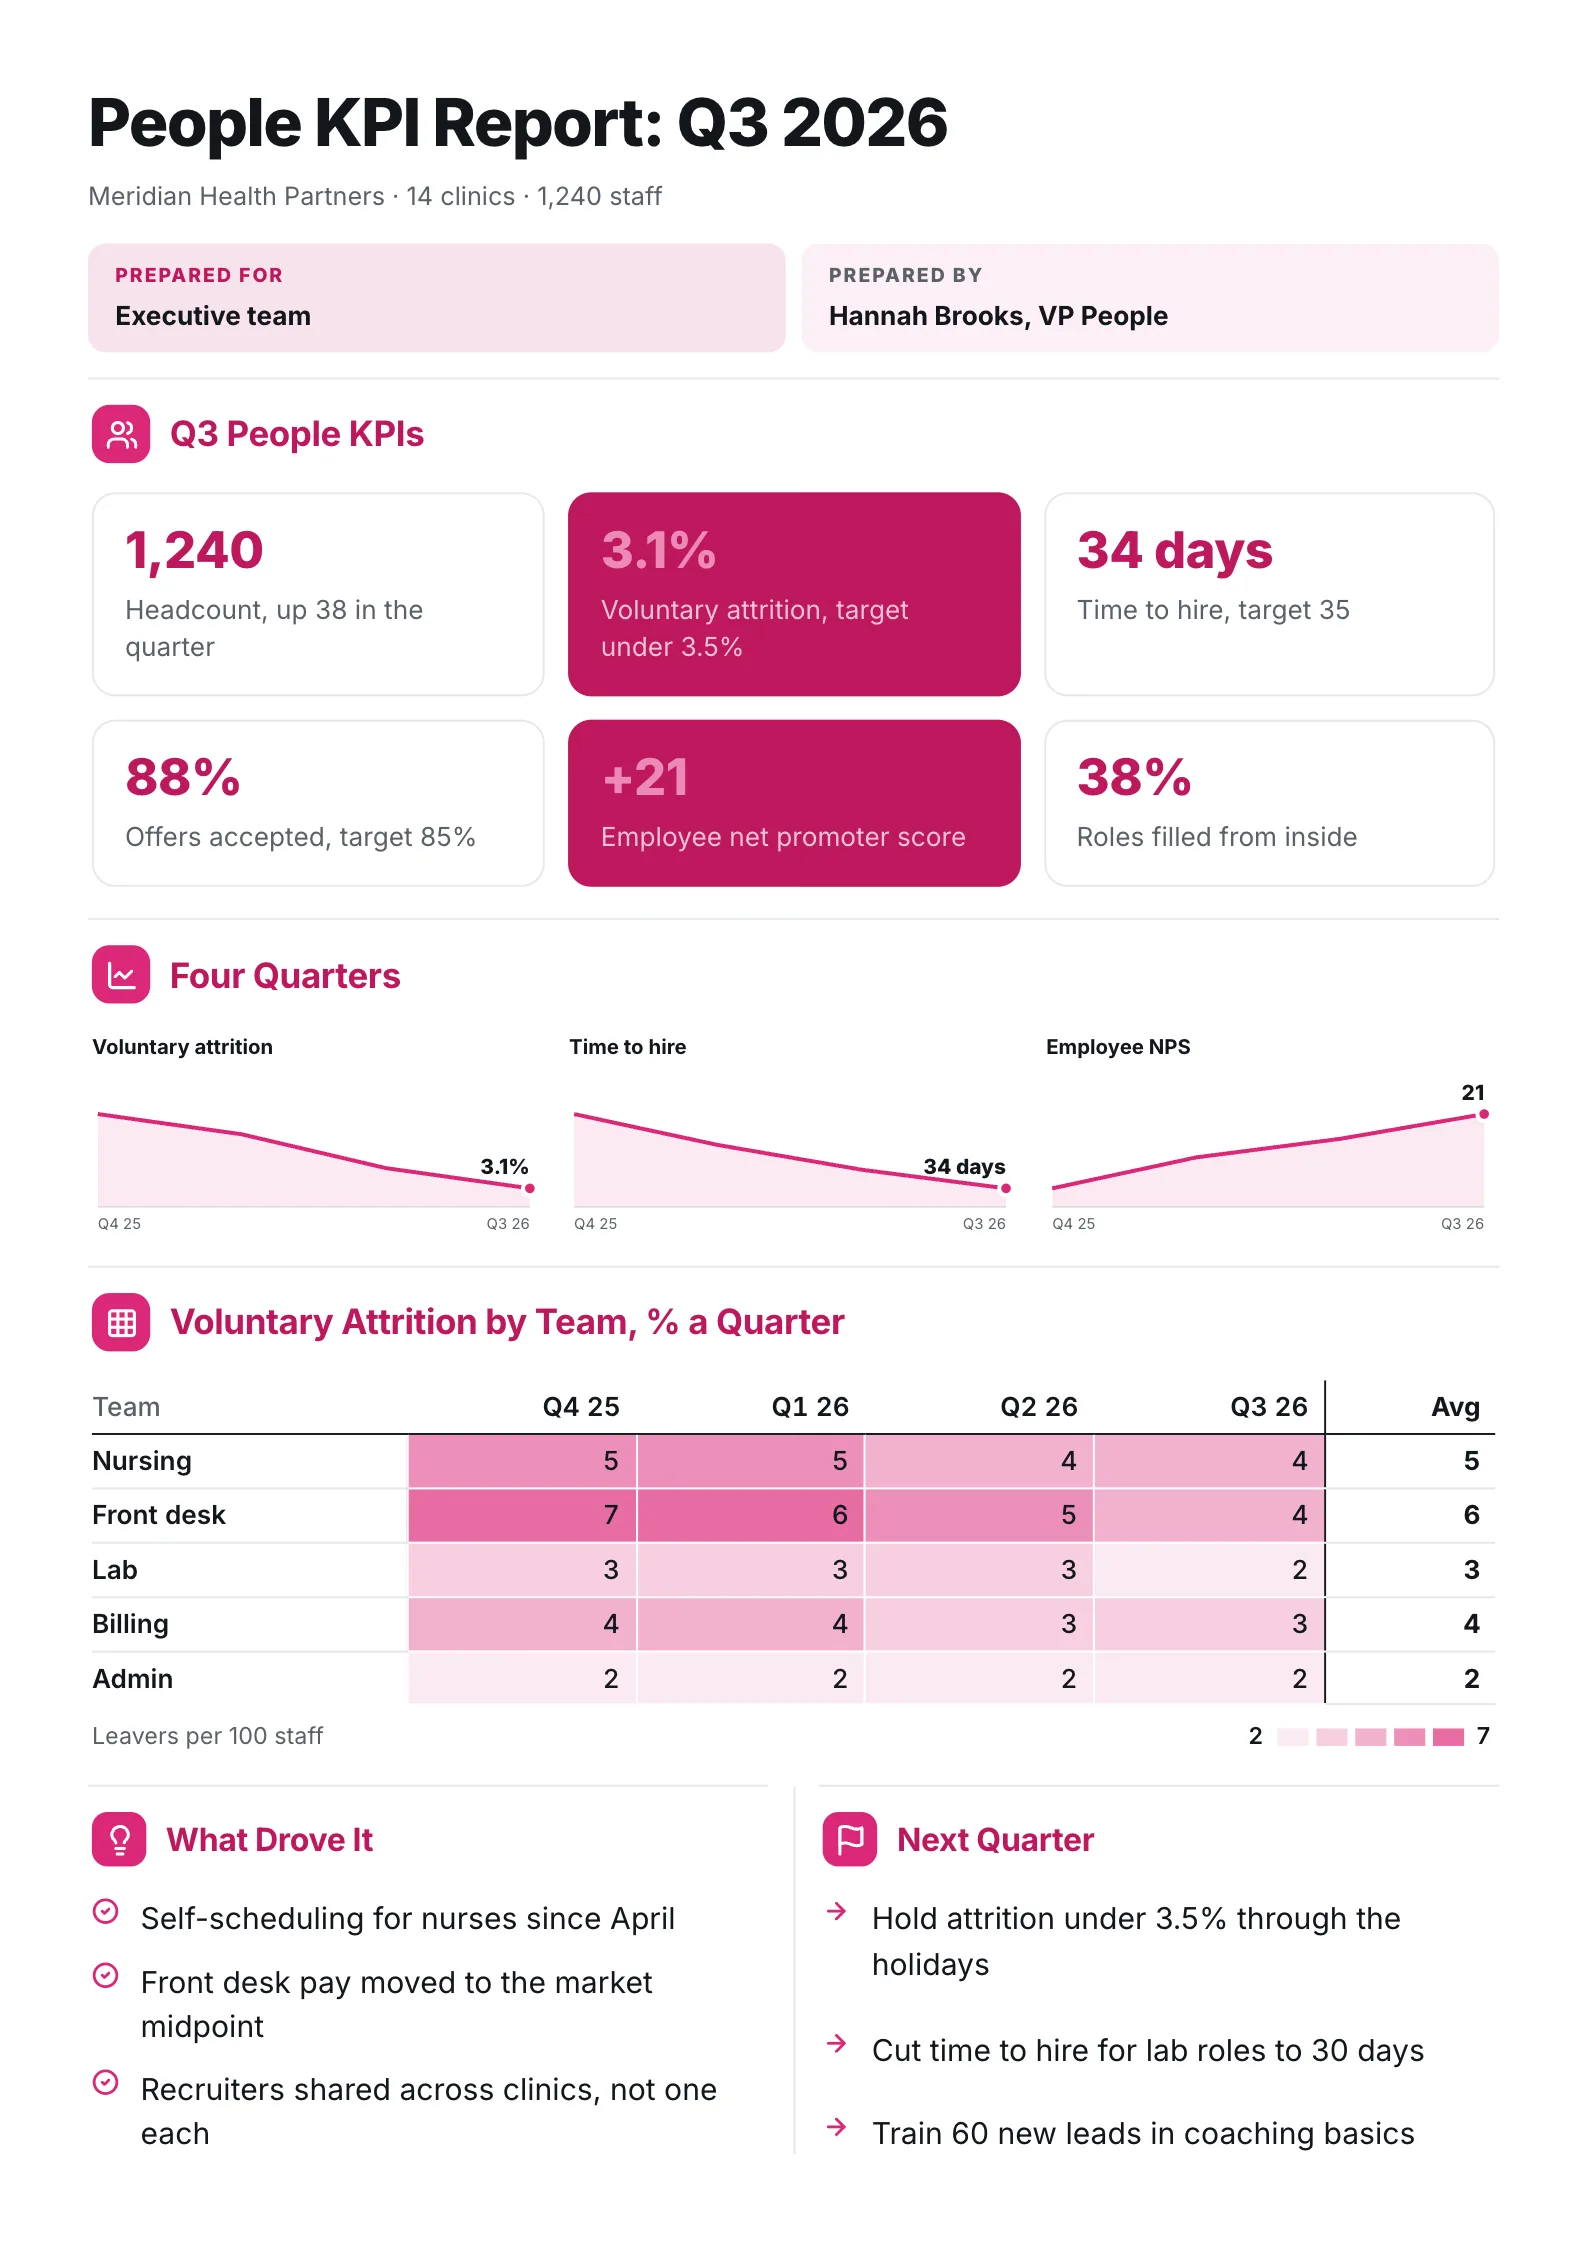 KPI Report: HR and People QuarterlyEdit for free(opens in a new tab)
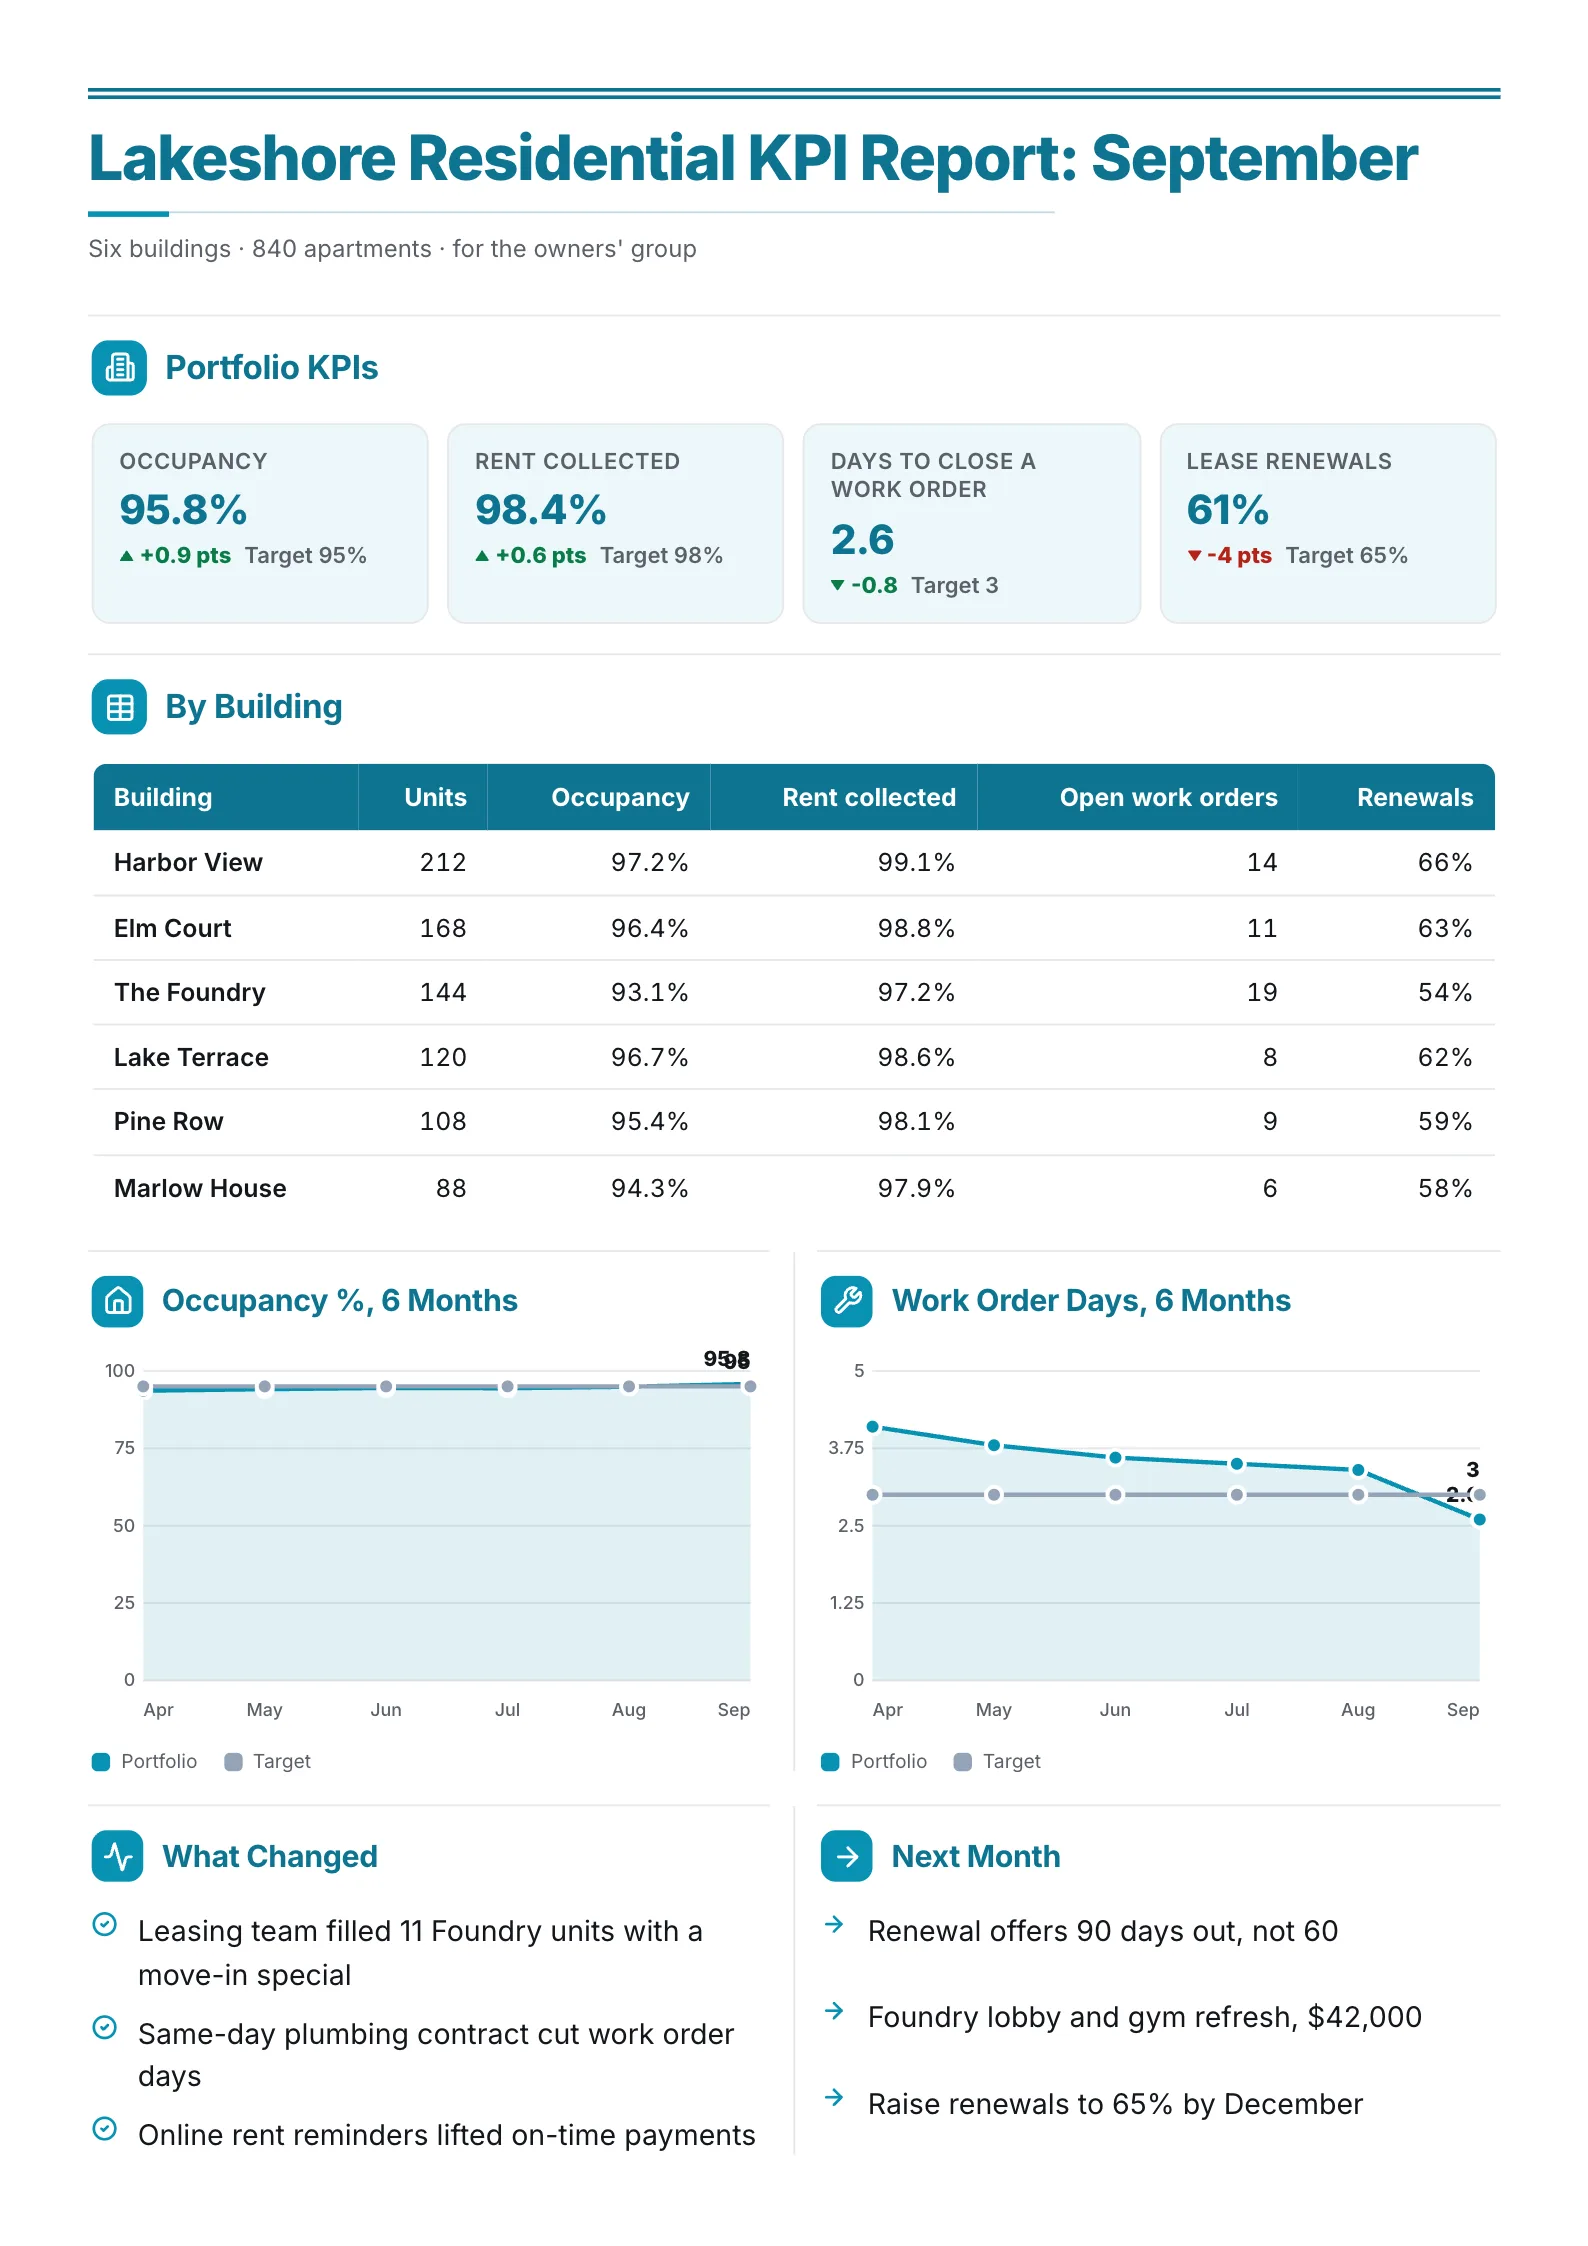 KPI Report: Property ManagementEdit for free(opens in a new tab)
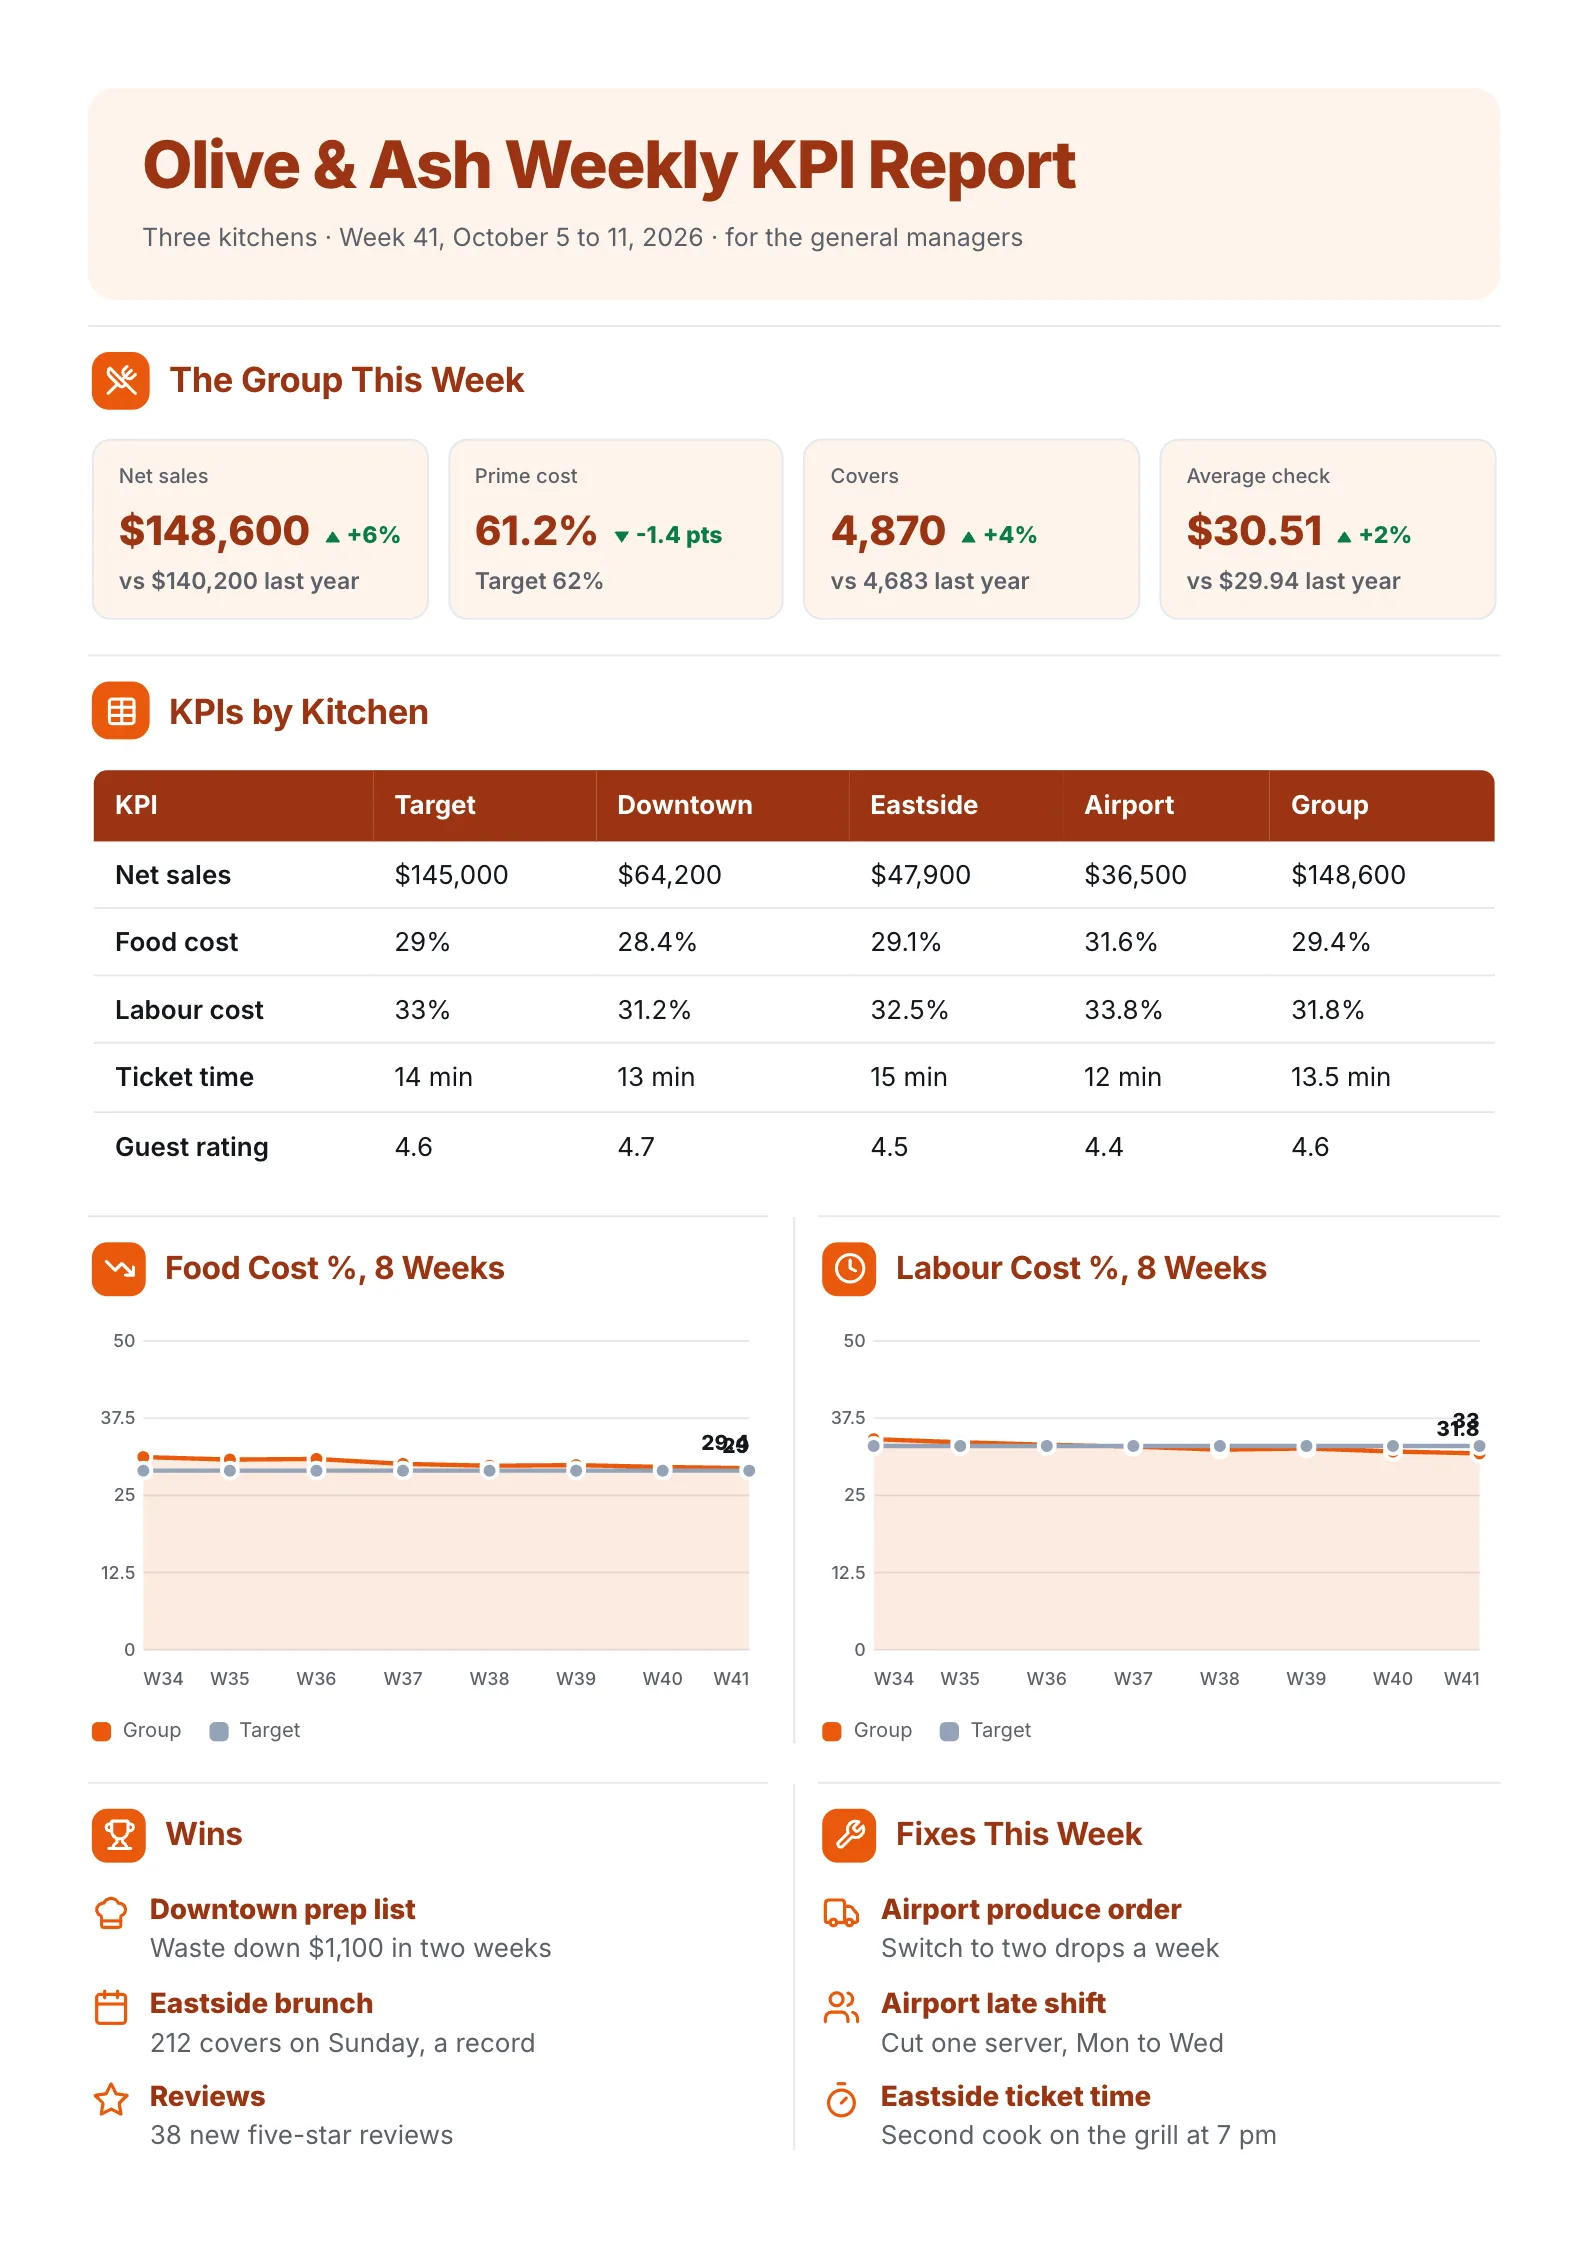 KPI Report: Restaurant Group WeeklyEdit for free(opens in a new tab)
Every example was made with MakeOnepagers. Each one opens as a template you can edit for free: every word, chart and color.
What is a KPI report?
A KPI report is a regular summary of performance against agreed targets. It might be weekly for a sales team, monthly for a plant or a store, or quarterly for a board.
A metric is anything you can count: visits, calls, units shipped. A KPI is a metric you have chosen because it tells you whether you are reaching a goal, and given a target. Every KPI is a metric. Most metrics are not KPIs. The report is valuable because it leaves the rest out.
KPIs also come in two kinds, and a good report has both:
- Lagging KPIs report results that have already happened: revenue, scrap rate, customer churn.
- Leading KPIs move before the results do: pipeline value, machine downtime, first-response time. They give you time to act.
The 6 parts of a KPI report
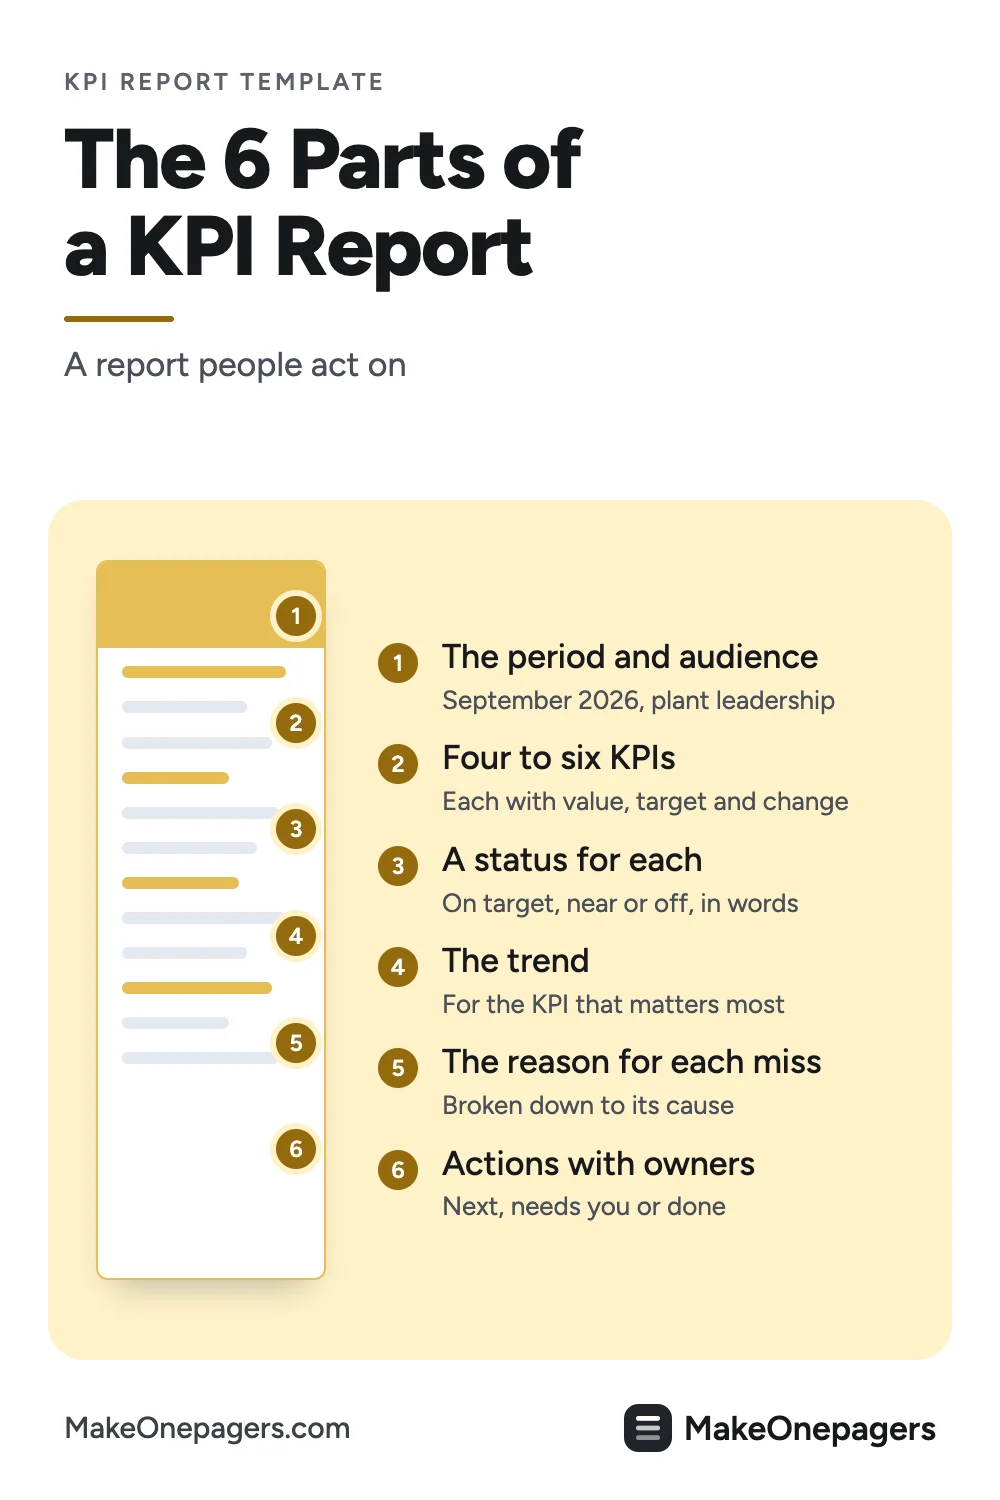
- The period and the audience. "September 2026, plant leadership."
- Four to six KPIs, each with this period's value, the target and the change since last period.
- A status for each: on target, near, or off. Color helps, but say it in words too.
- A trend for the KPI that matters most, over three to twelve periods.
- The reason behind each miss, broken down so it points at a cause.
- Actions, each with an owner and a status, so next period's report can say what was done.
A free KPI report template
Copy this into a document, or open one of the examples further down and edit it.
| Part | What to write, with an example |
|---|---|
| Title | Team and period. Plant KPI Dashboard, September 2026 |
| For | Plant leadership |
| This period | Four KPIs, each with value, change and target. On time 93.5%, down 1.1 points, target 95% |
| Trend | The main KPI over the last few periods |
| Breakdown | The cause of the biggest miss, split into its parts |
| By team or line | Each line or shift against the target |
| Actions | Each with an owner and a status: Next, Needs you, Done |
| Note | How each KPI is calculated, where the data comes from |
A worked example: a molding plant's month
 Edit this template
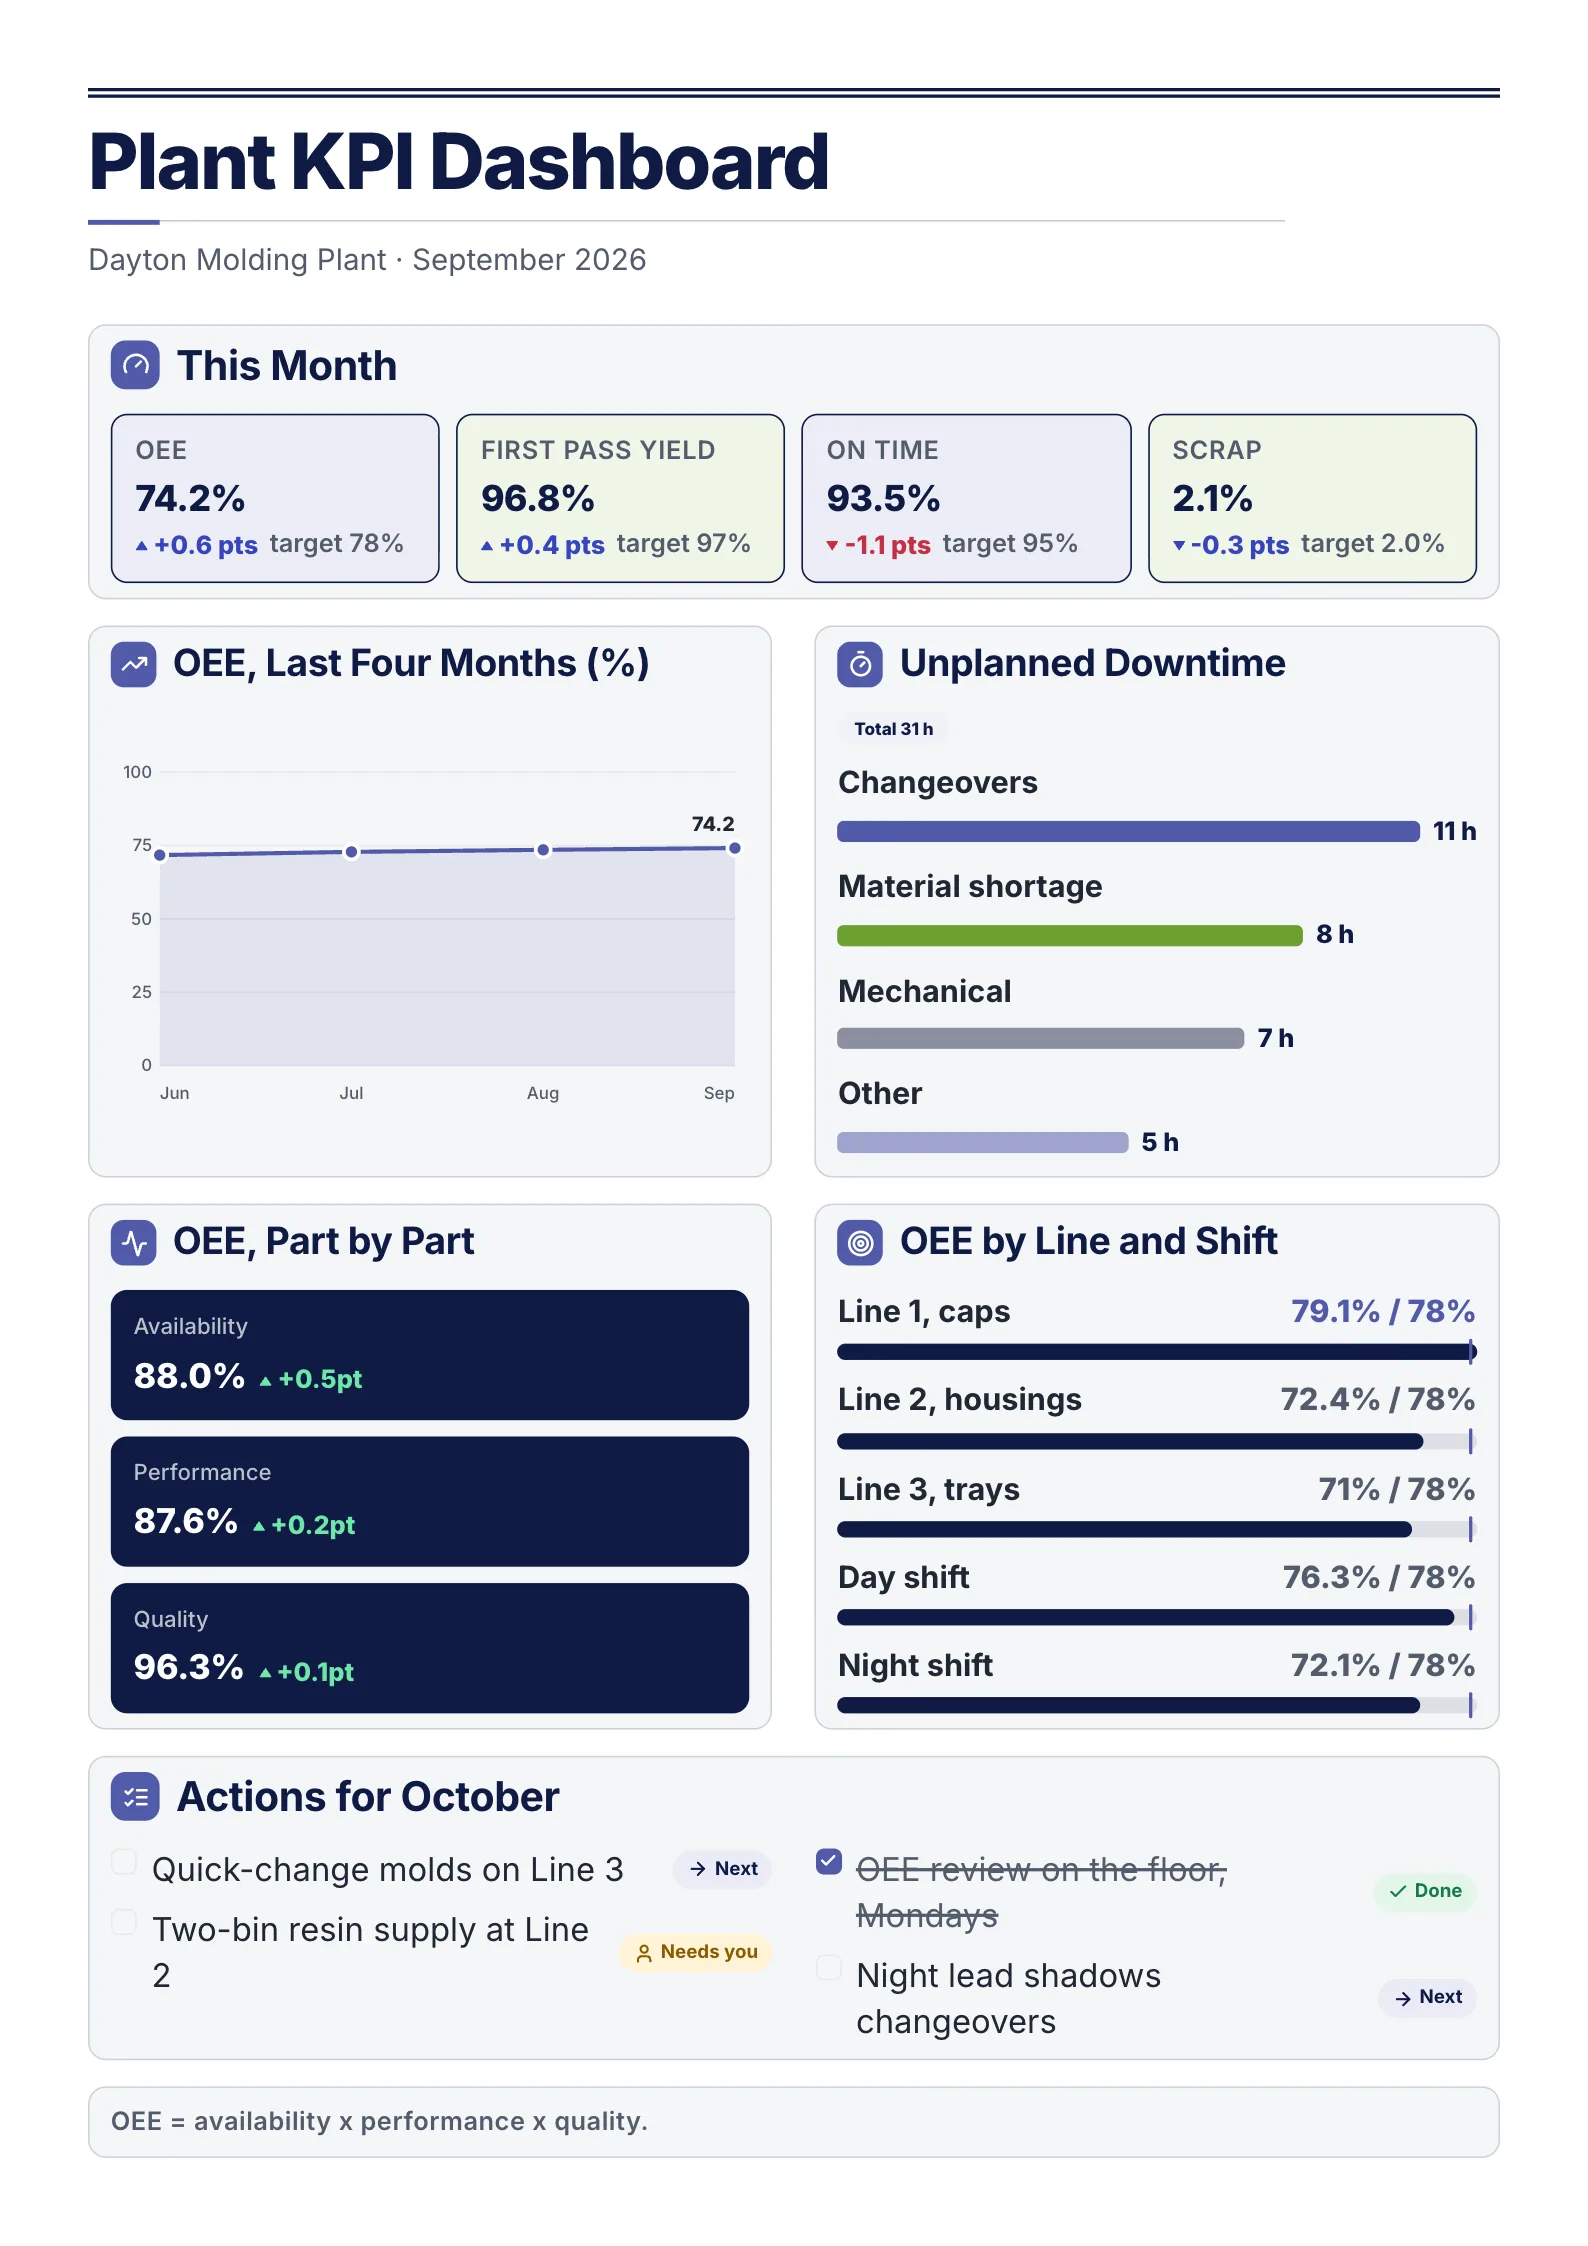
A sample plant with illustrative figures, the way a plant manager would bring it to a monthly review.
The plant and figures are a sample. Here is how the report reads, and the arithmetic behind it.
This month, against target
| KPI | September | Change | Target | Status |
|---|---|---|---|---|
| OEE | 74.2% | +0.6 points | 78% | Off |
| First pass yield | 96.8% | +0.4 points | 97% | Near |
| On time | 93.5% | -1.1 points | 95% | Off |
| Scrap | 2.1% | -0.3 points | 2.0% | Near |
OEE broken into its three parts. OEE, overall equipment effectiveness, is availability × performance × quality. Here that is 88.0% × 87.6% × 96.3% = 74.2%. Breaking it down shows where the loss is: quality is high, so the gap to 78% sits mostly in availability and performance.
Why availability is low. 31 hours of unplanned downtime: changeovers 11 hours, material shortage 8, mechanical 7, other 5. Changeovers are the biggest single cause, which points straight at an action.
By line and shift. Line 1 runs at 79.1%, above target. Lines 2 and 3 run at 72.4% and 71%. Day shift reaches 76.3% and night shift 72.1%. The miss is concentrated, not spread evenly.
Actions for October
- Quick-change molds on Line 3: next.
- Two-bin resin supply at Line 2: needs a decision from leadership.
- Night lead shadows changeovers: next.
- OEE review on the floor every Monday: done.
Each action answers one of the causes above. Next month's report starts by ticking them off.
Edit for free: manufacturing KPI dashboard template.
5 KPI report examples
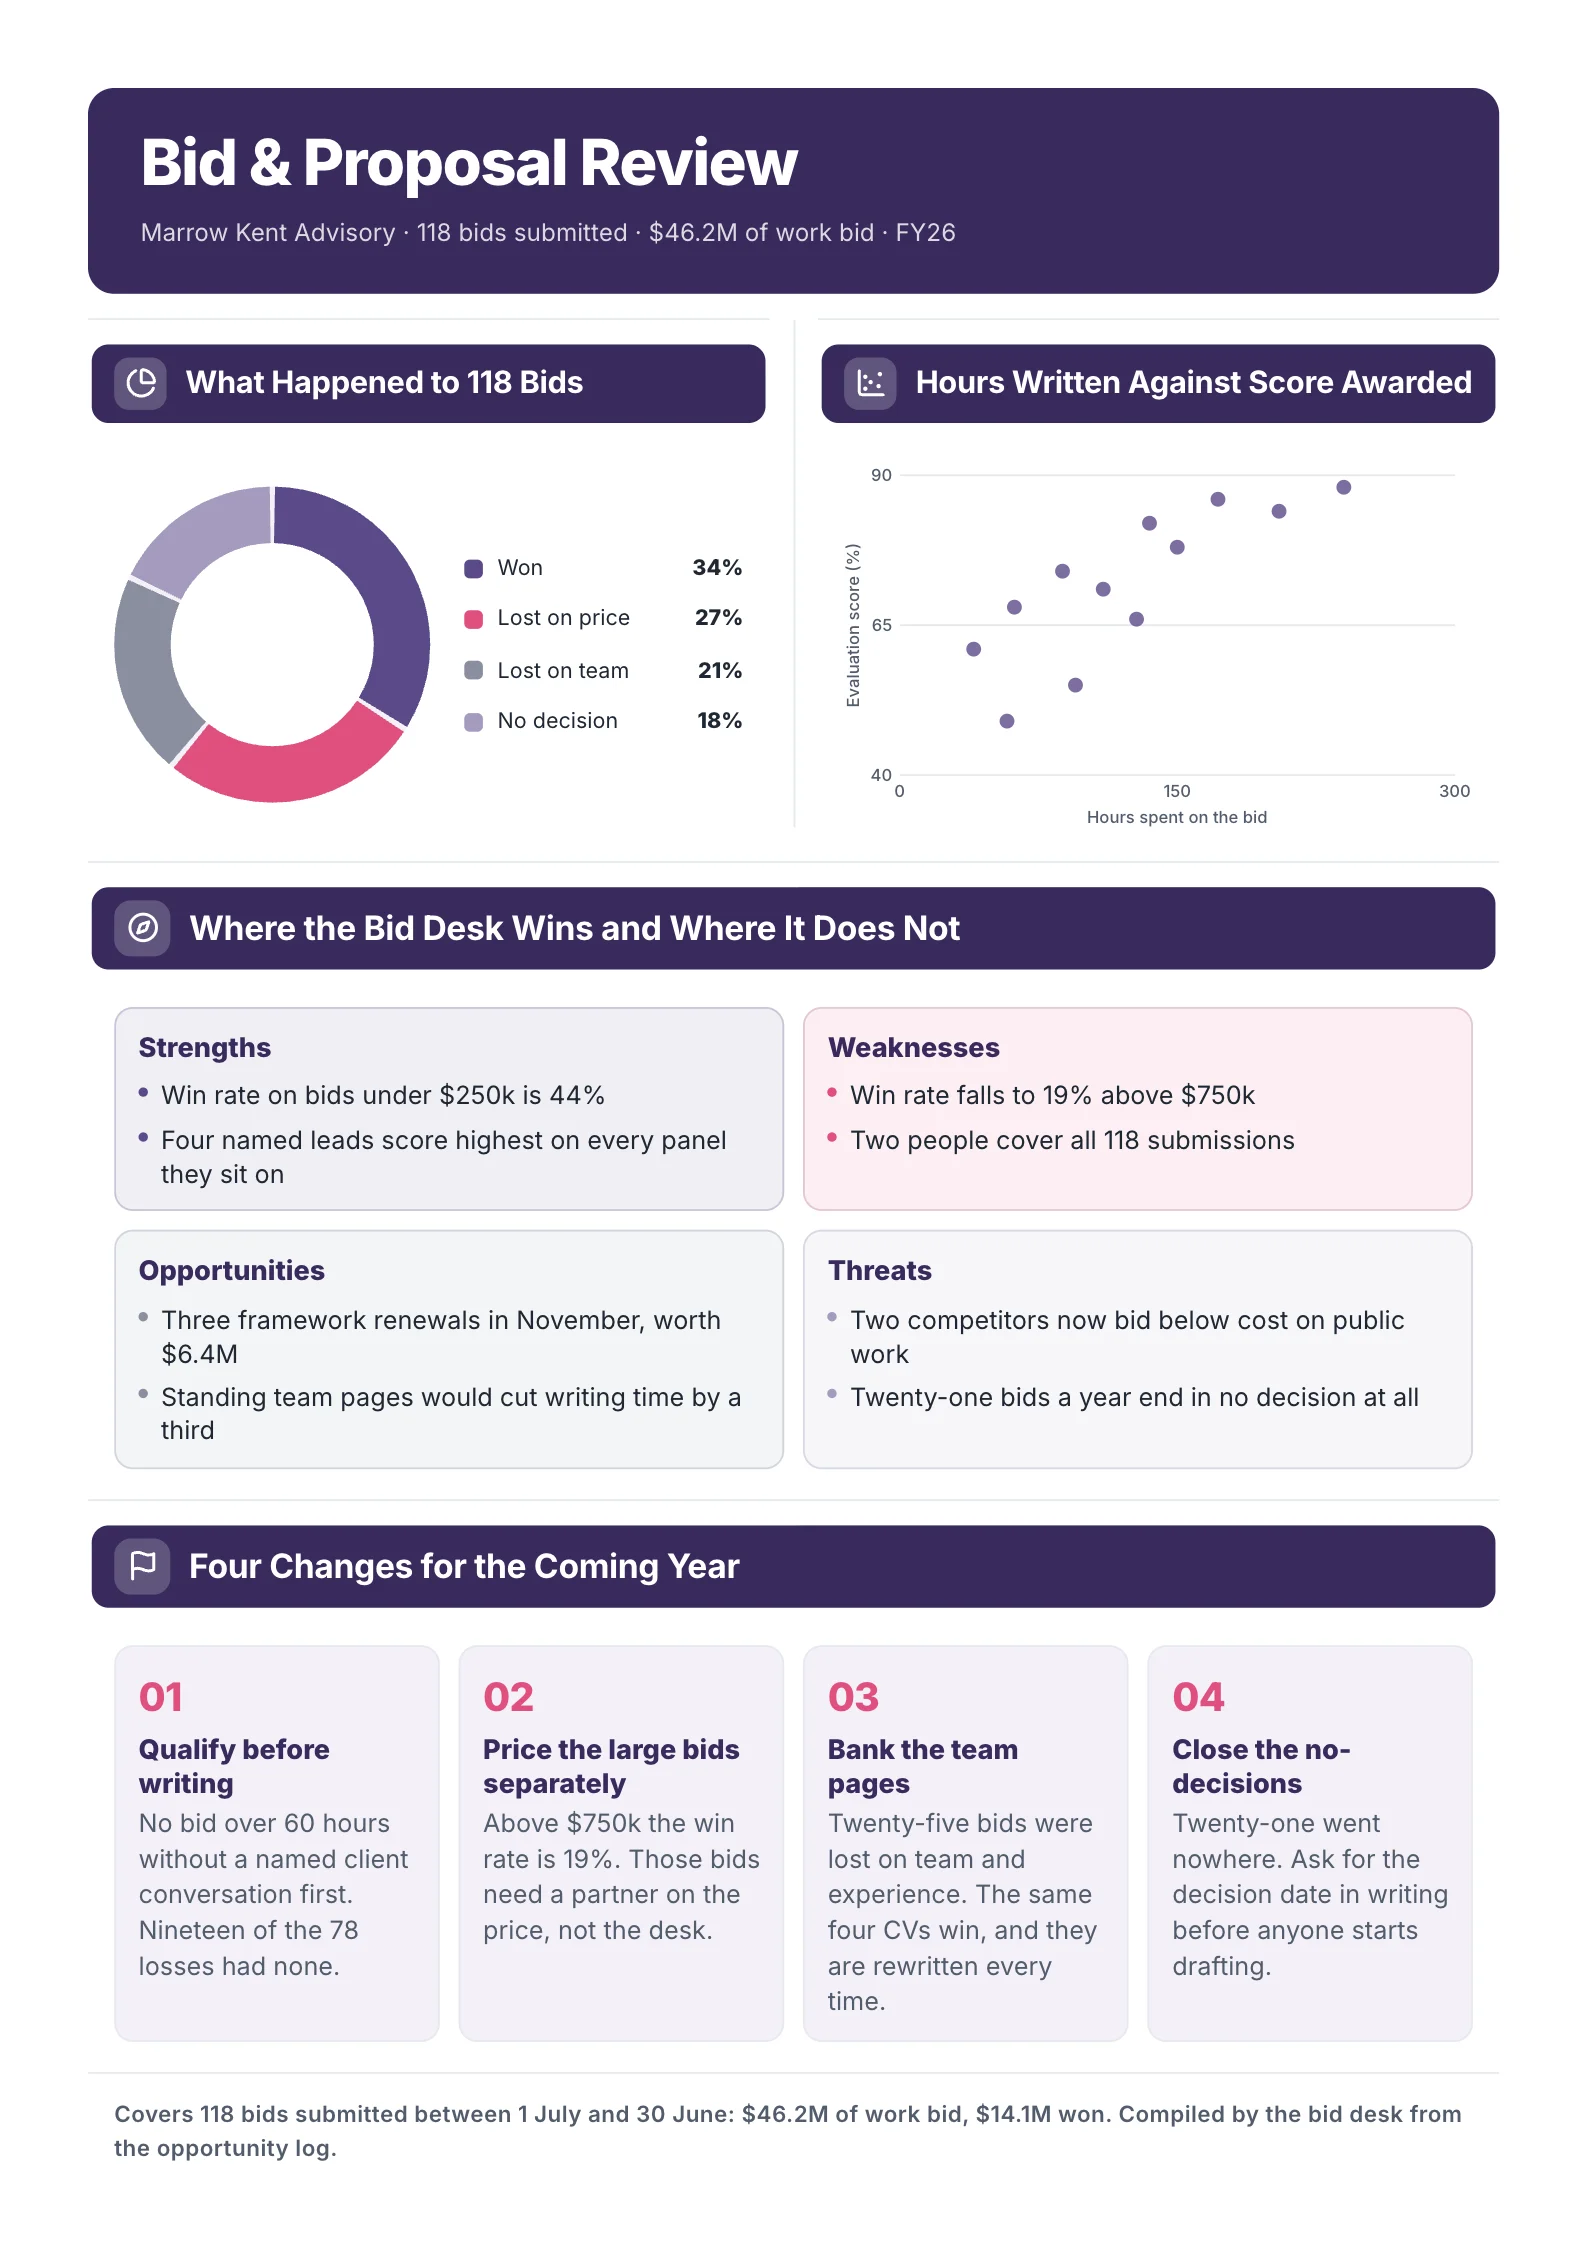
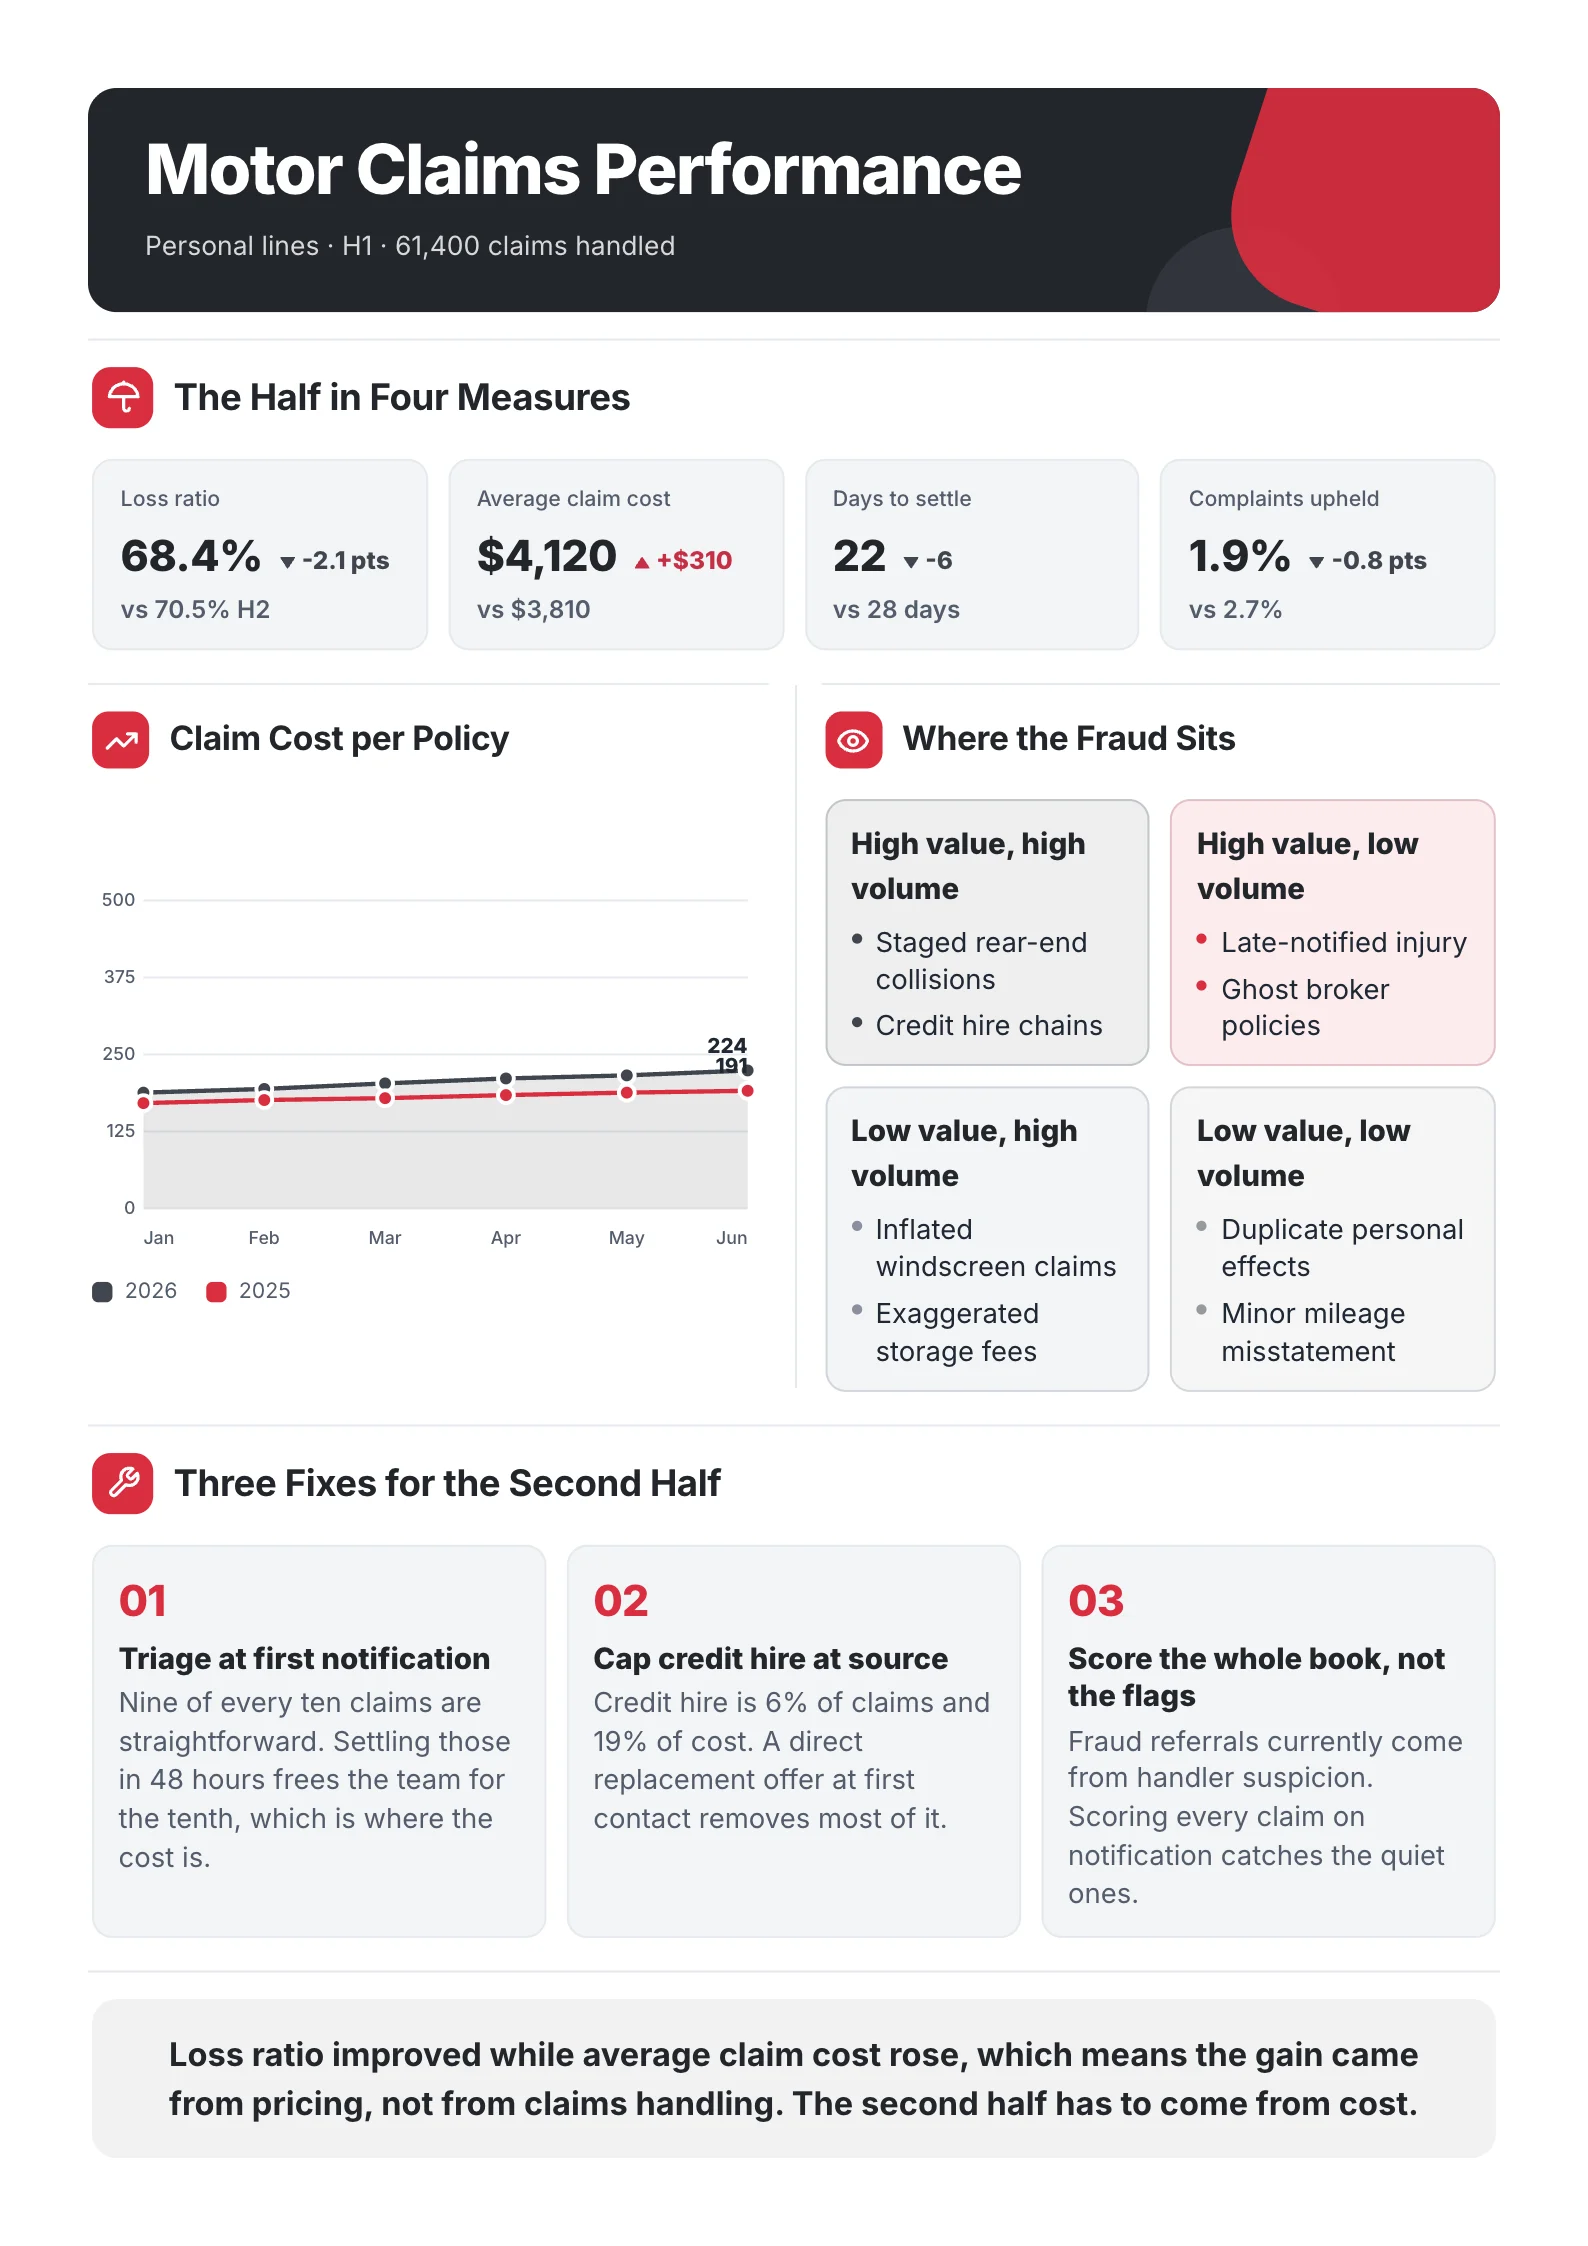
Five more KPI reports, each for a different reader and a different period: a coffee company owner's quarter, a software company's month, a clinic's month, a marketing team's month and a warehouse's month. Each keeps the six parts above.
1. Small business KPI report
 Edit this template
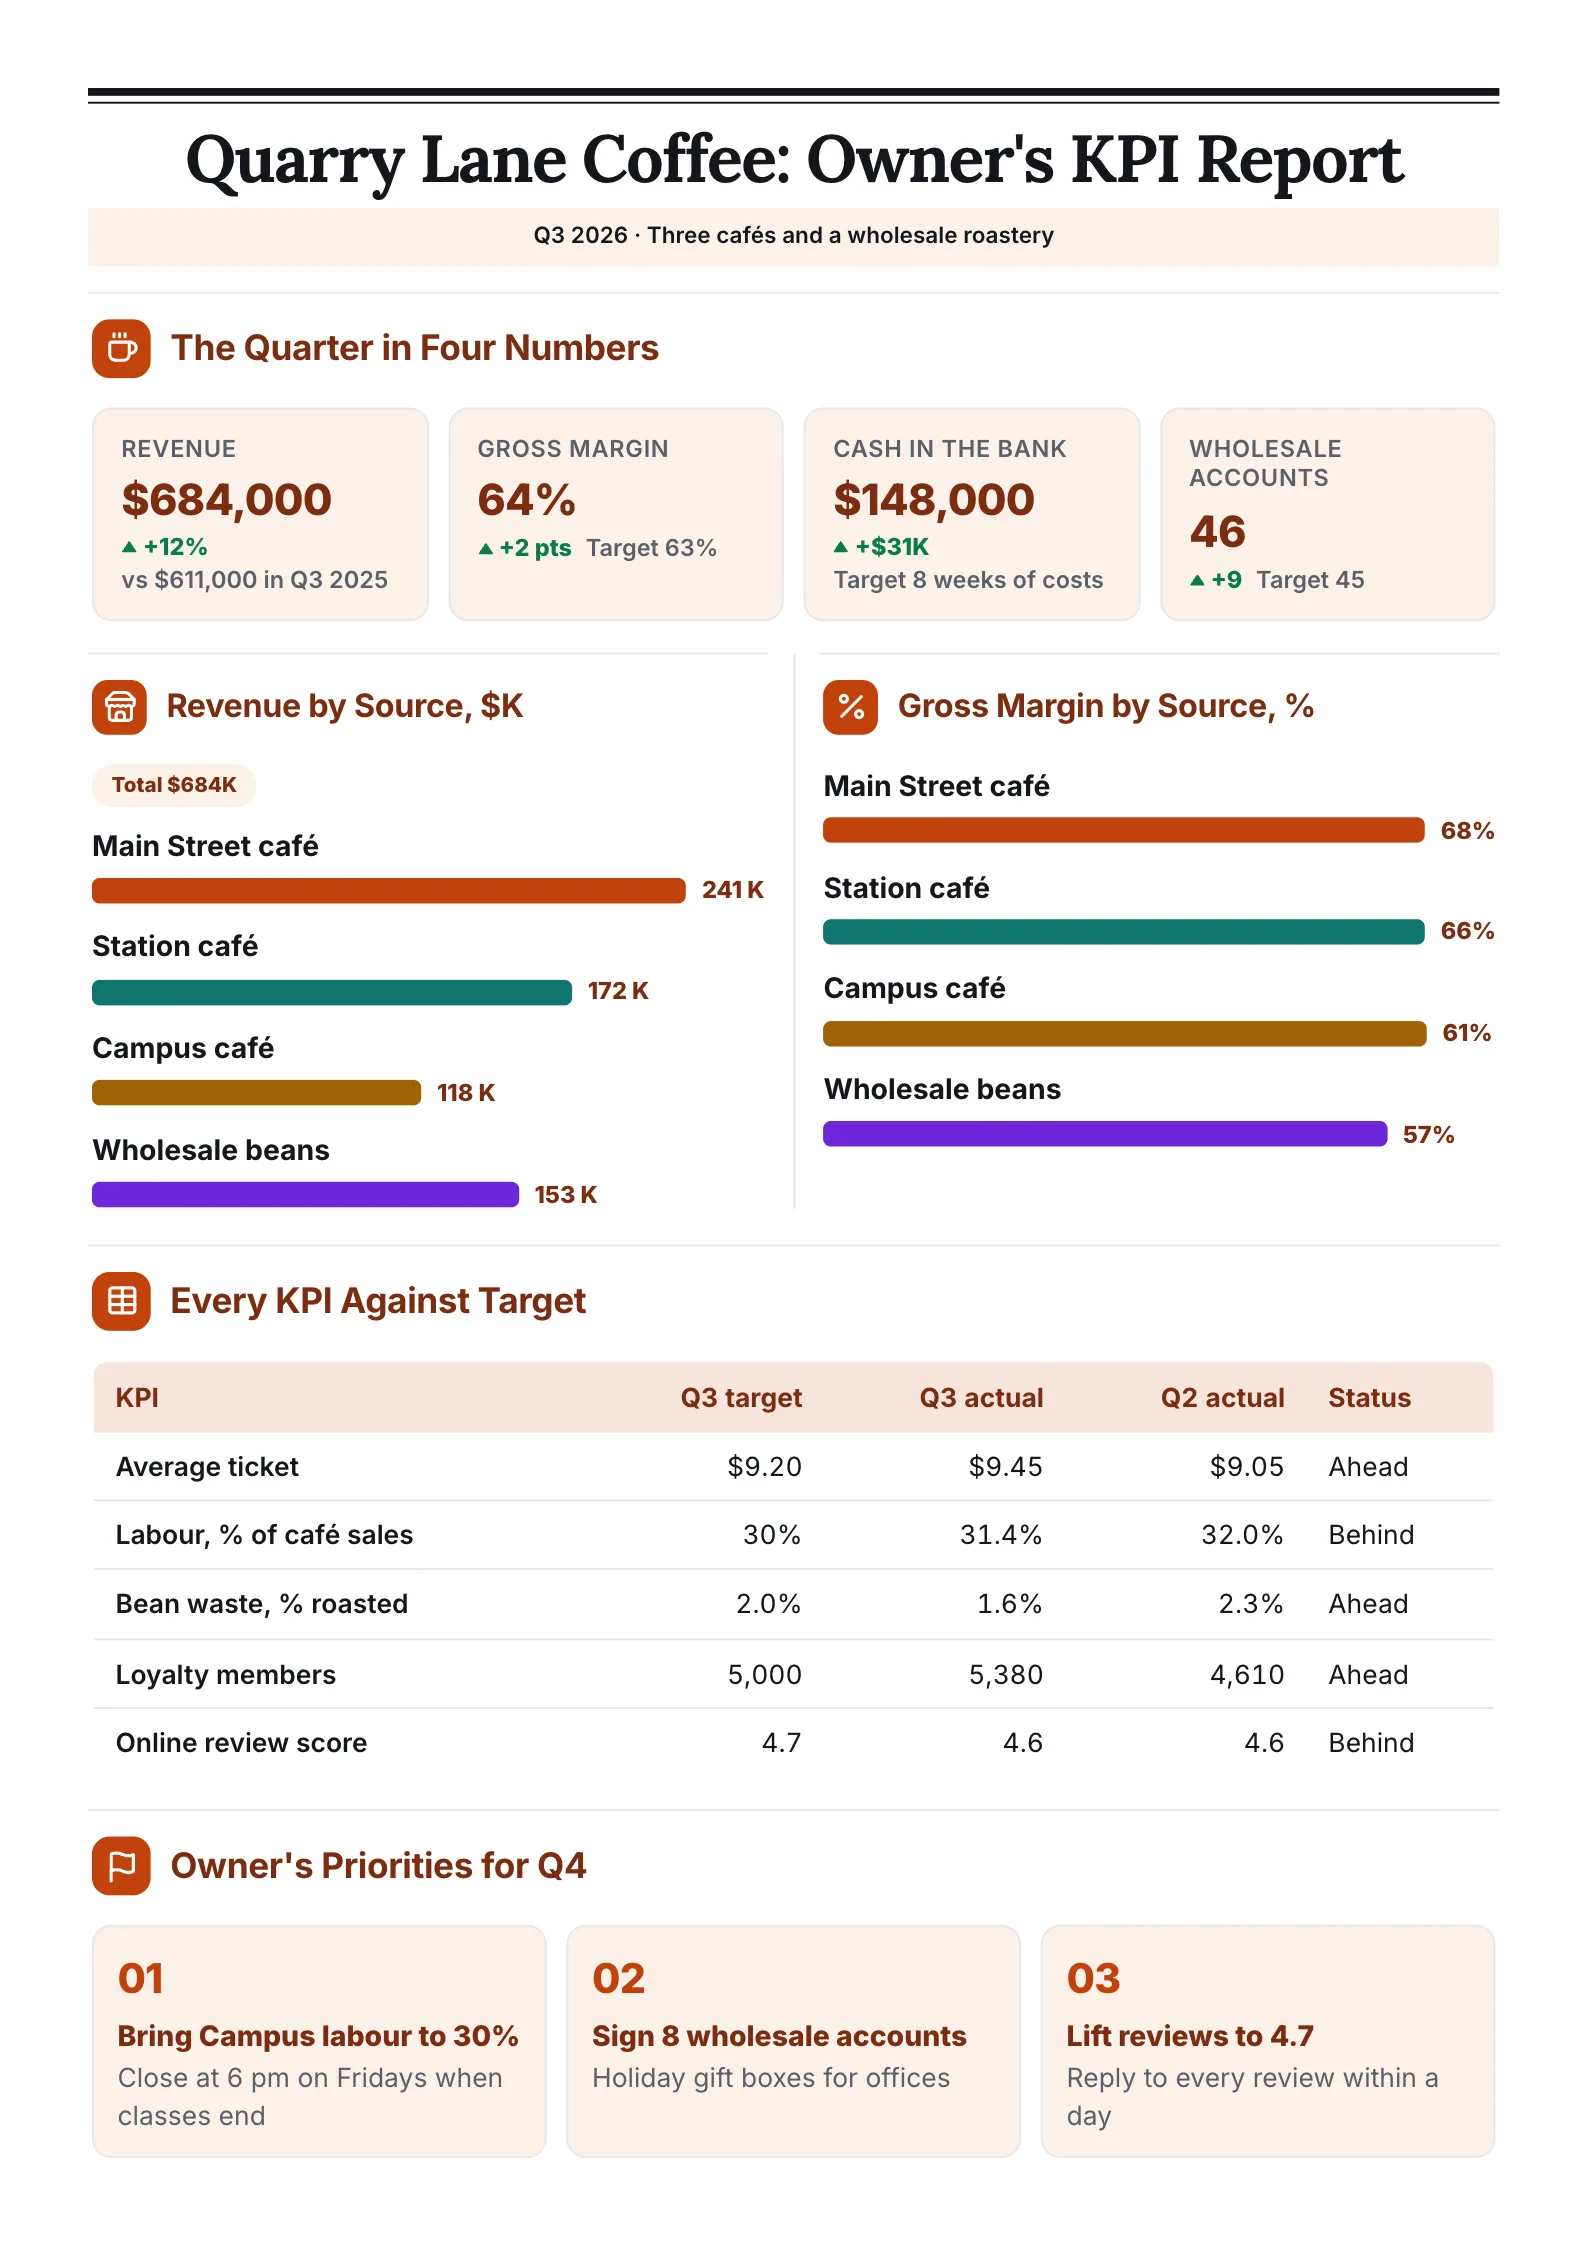
An owner's quarter in four numbers, then every KPI against its target.
What to copy:
- Four numbers first. Revenue $684,000, gross margin 64%, cash $148,000 and 46 wholesale accounts, each with its change.
- Last quarter beside this one. Labour ran 31.4% of café sales against a 30% target, down from 32.0% in Q2.
- Priorities that answer the misses. "Bring Campus labour to 30%" by closing at 6 pm on Fridays when classes end.
Edit for free: small business KPI report template.
2. SaaS monthly KPI report
 Edit this template
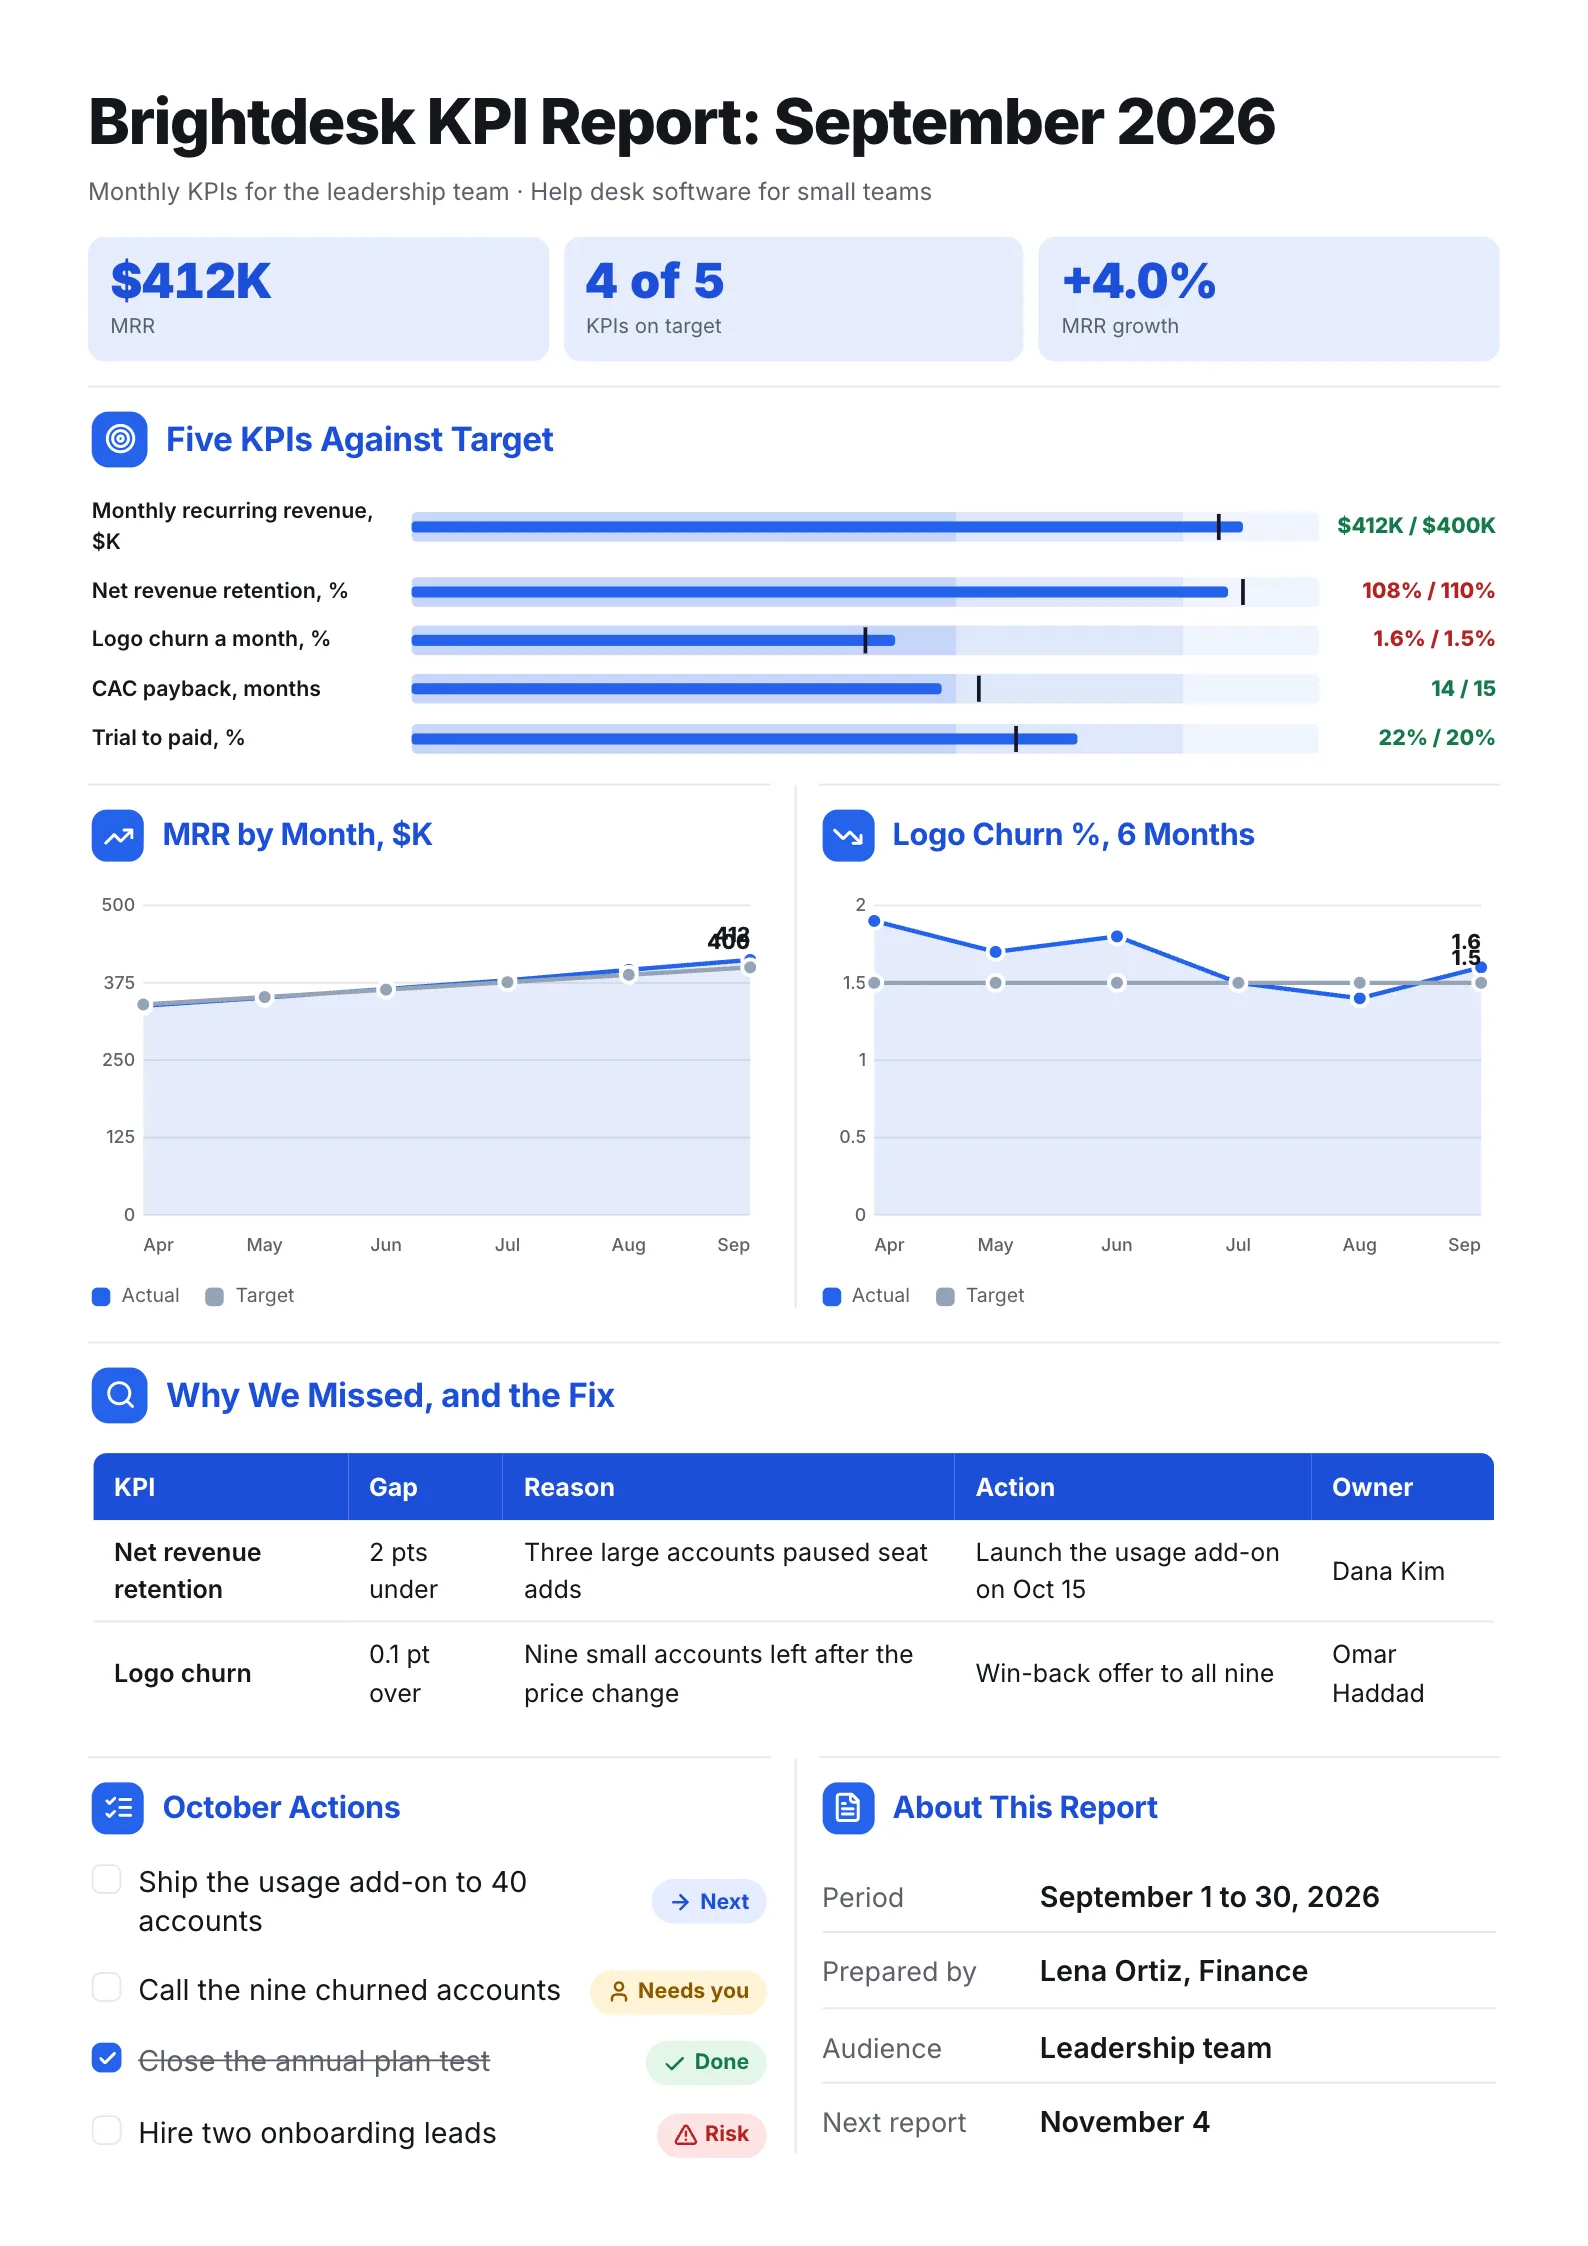
A software company's month: five KPIs against target, then a table for every miss.
What to copy:
- Actual over target in one line. "$412K / $400K" for recurring revenue reads in a second.
- A row for each miss. Net revenue retention was 2 points under because three large accounts paused seat adds.
- The fix with an owner. Launch the usage add-on on October 15, owned by Dana Kim.
Edit for free: SaaS monthly KPI report template.
3. Clinic operations KPI report
 Edit this template
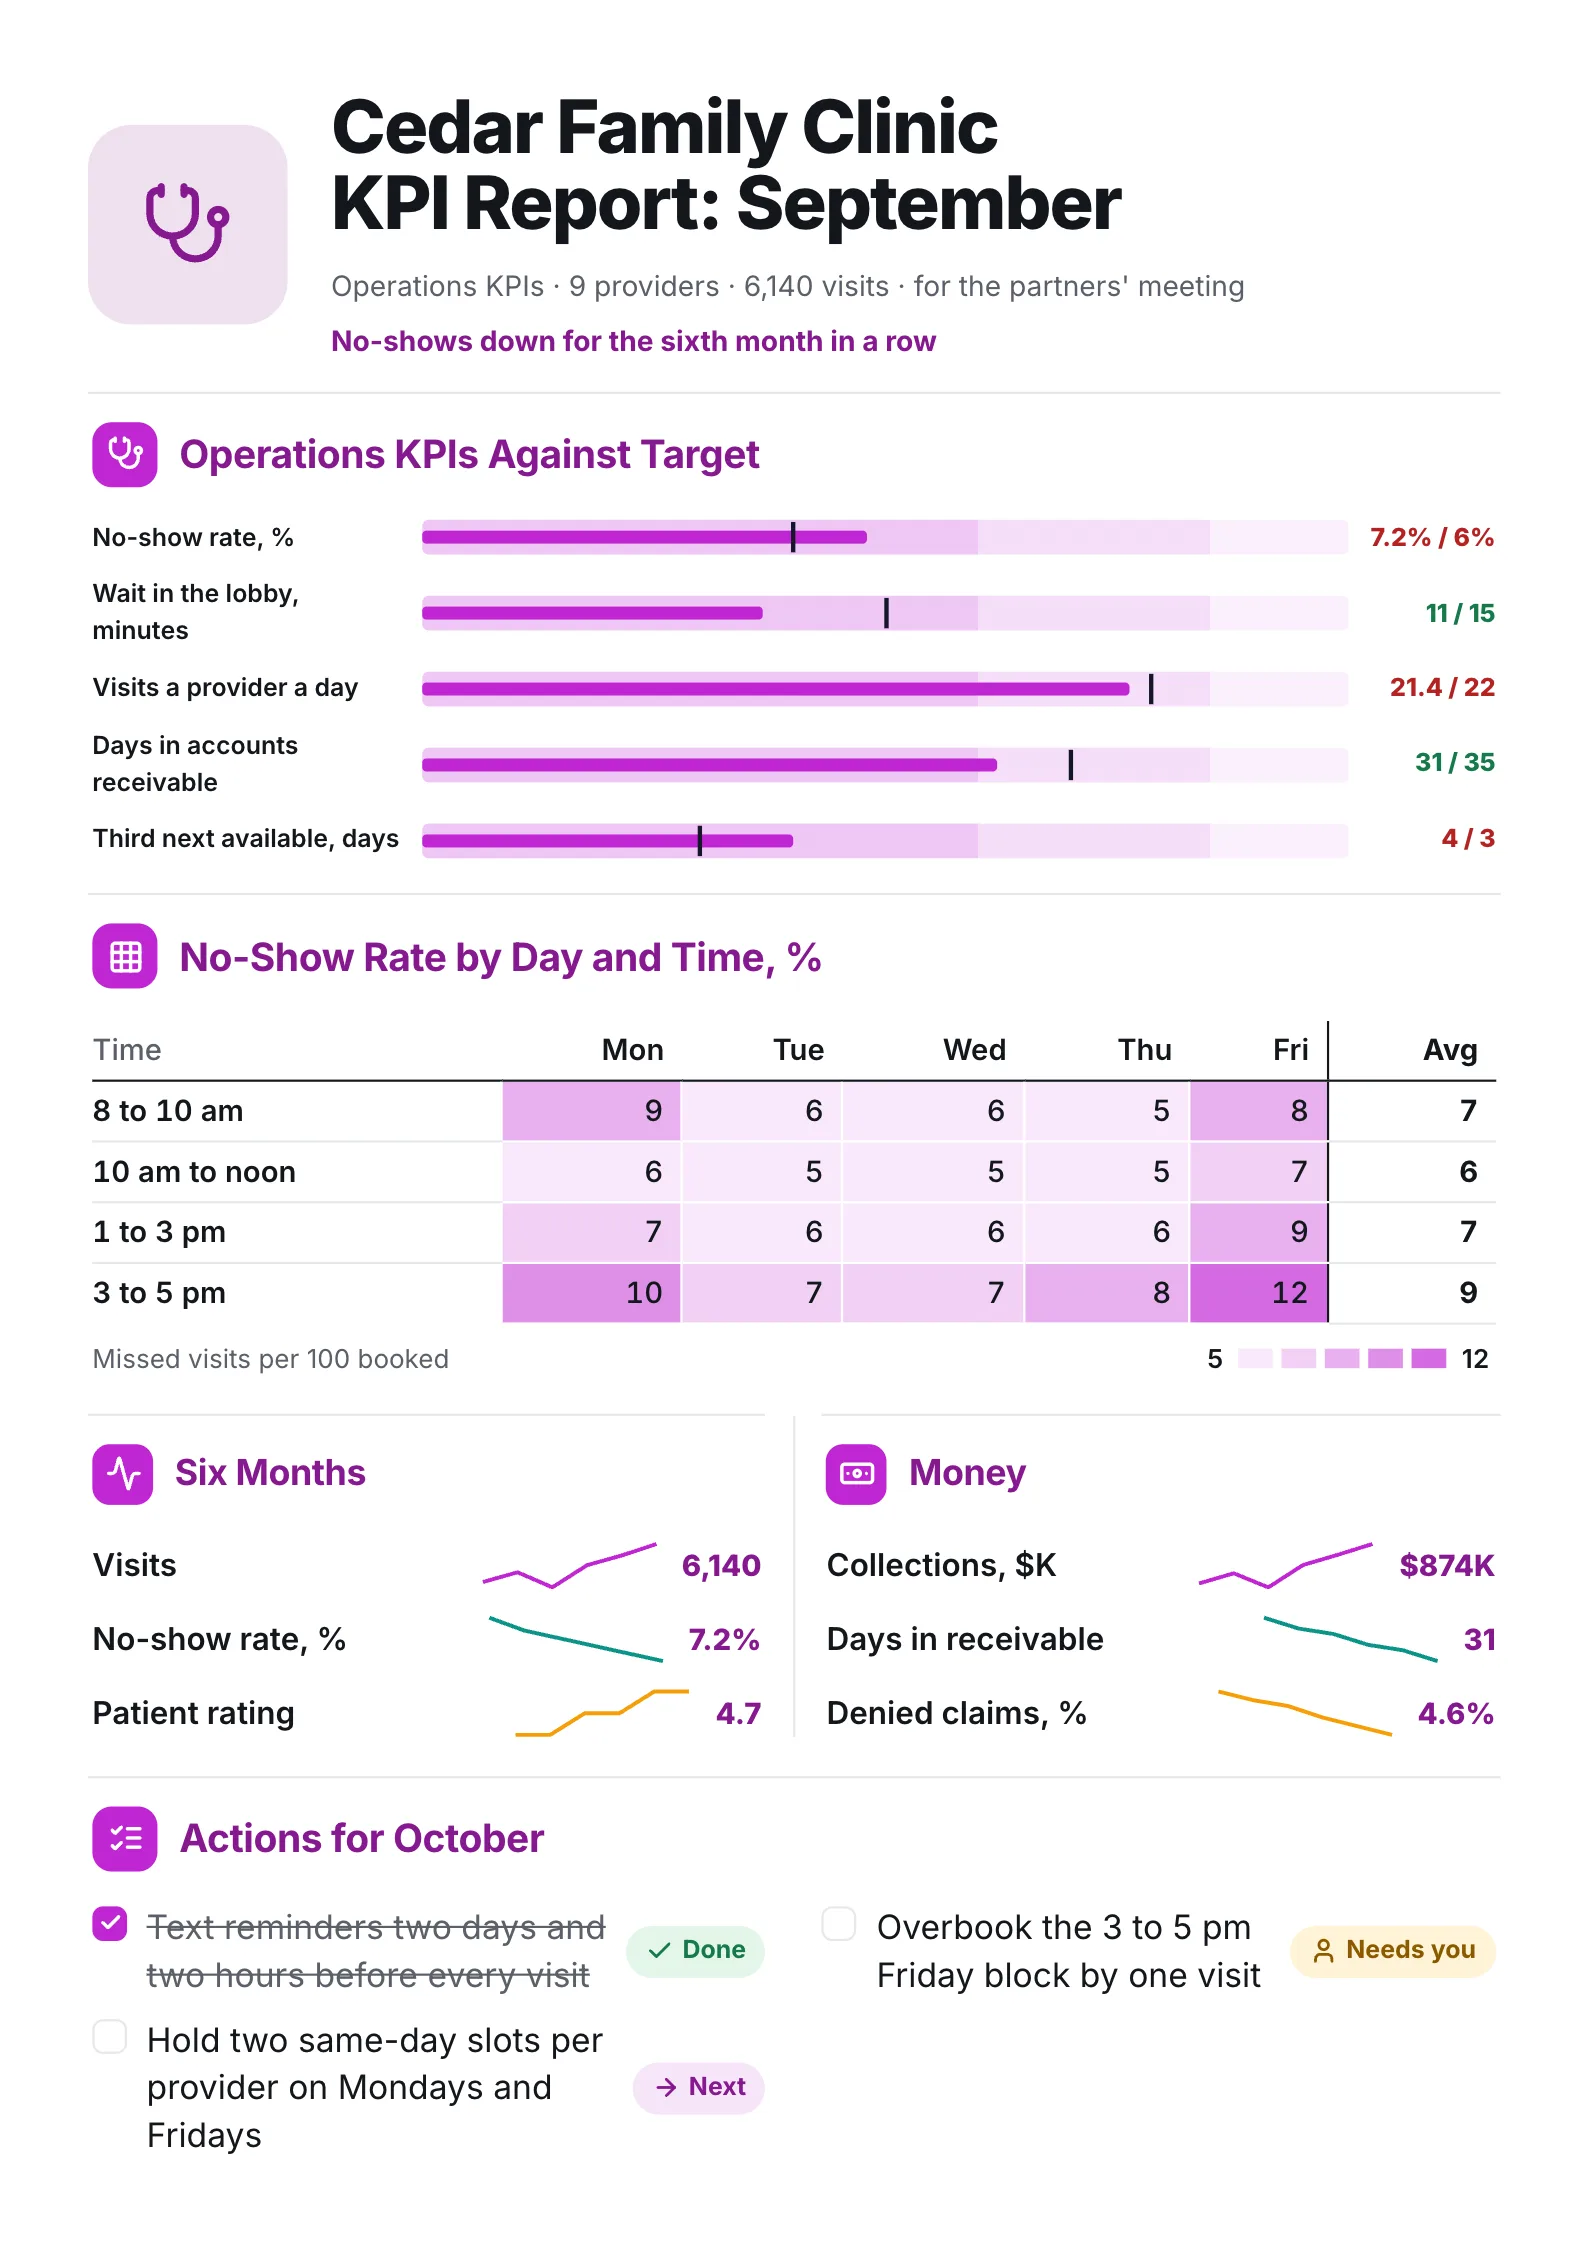
A family clinic shows where its no-shows happen, by day and hour.
What to copy:
- Every KPI against its target. No-show rate 7.2% against 6%, days in receivable 31 against 35.
- A heat map for the biggest miss. No-shows by day and hour, so the fix can target one slot: one extra booking in the 3 to 5 pm Friday slot.
- Actions you can check next month. Text reminders two days and two hours before every visit.
Edit for free: clinic operations KPI report template.
4. Marketing KPI report
 Edit this template
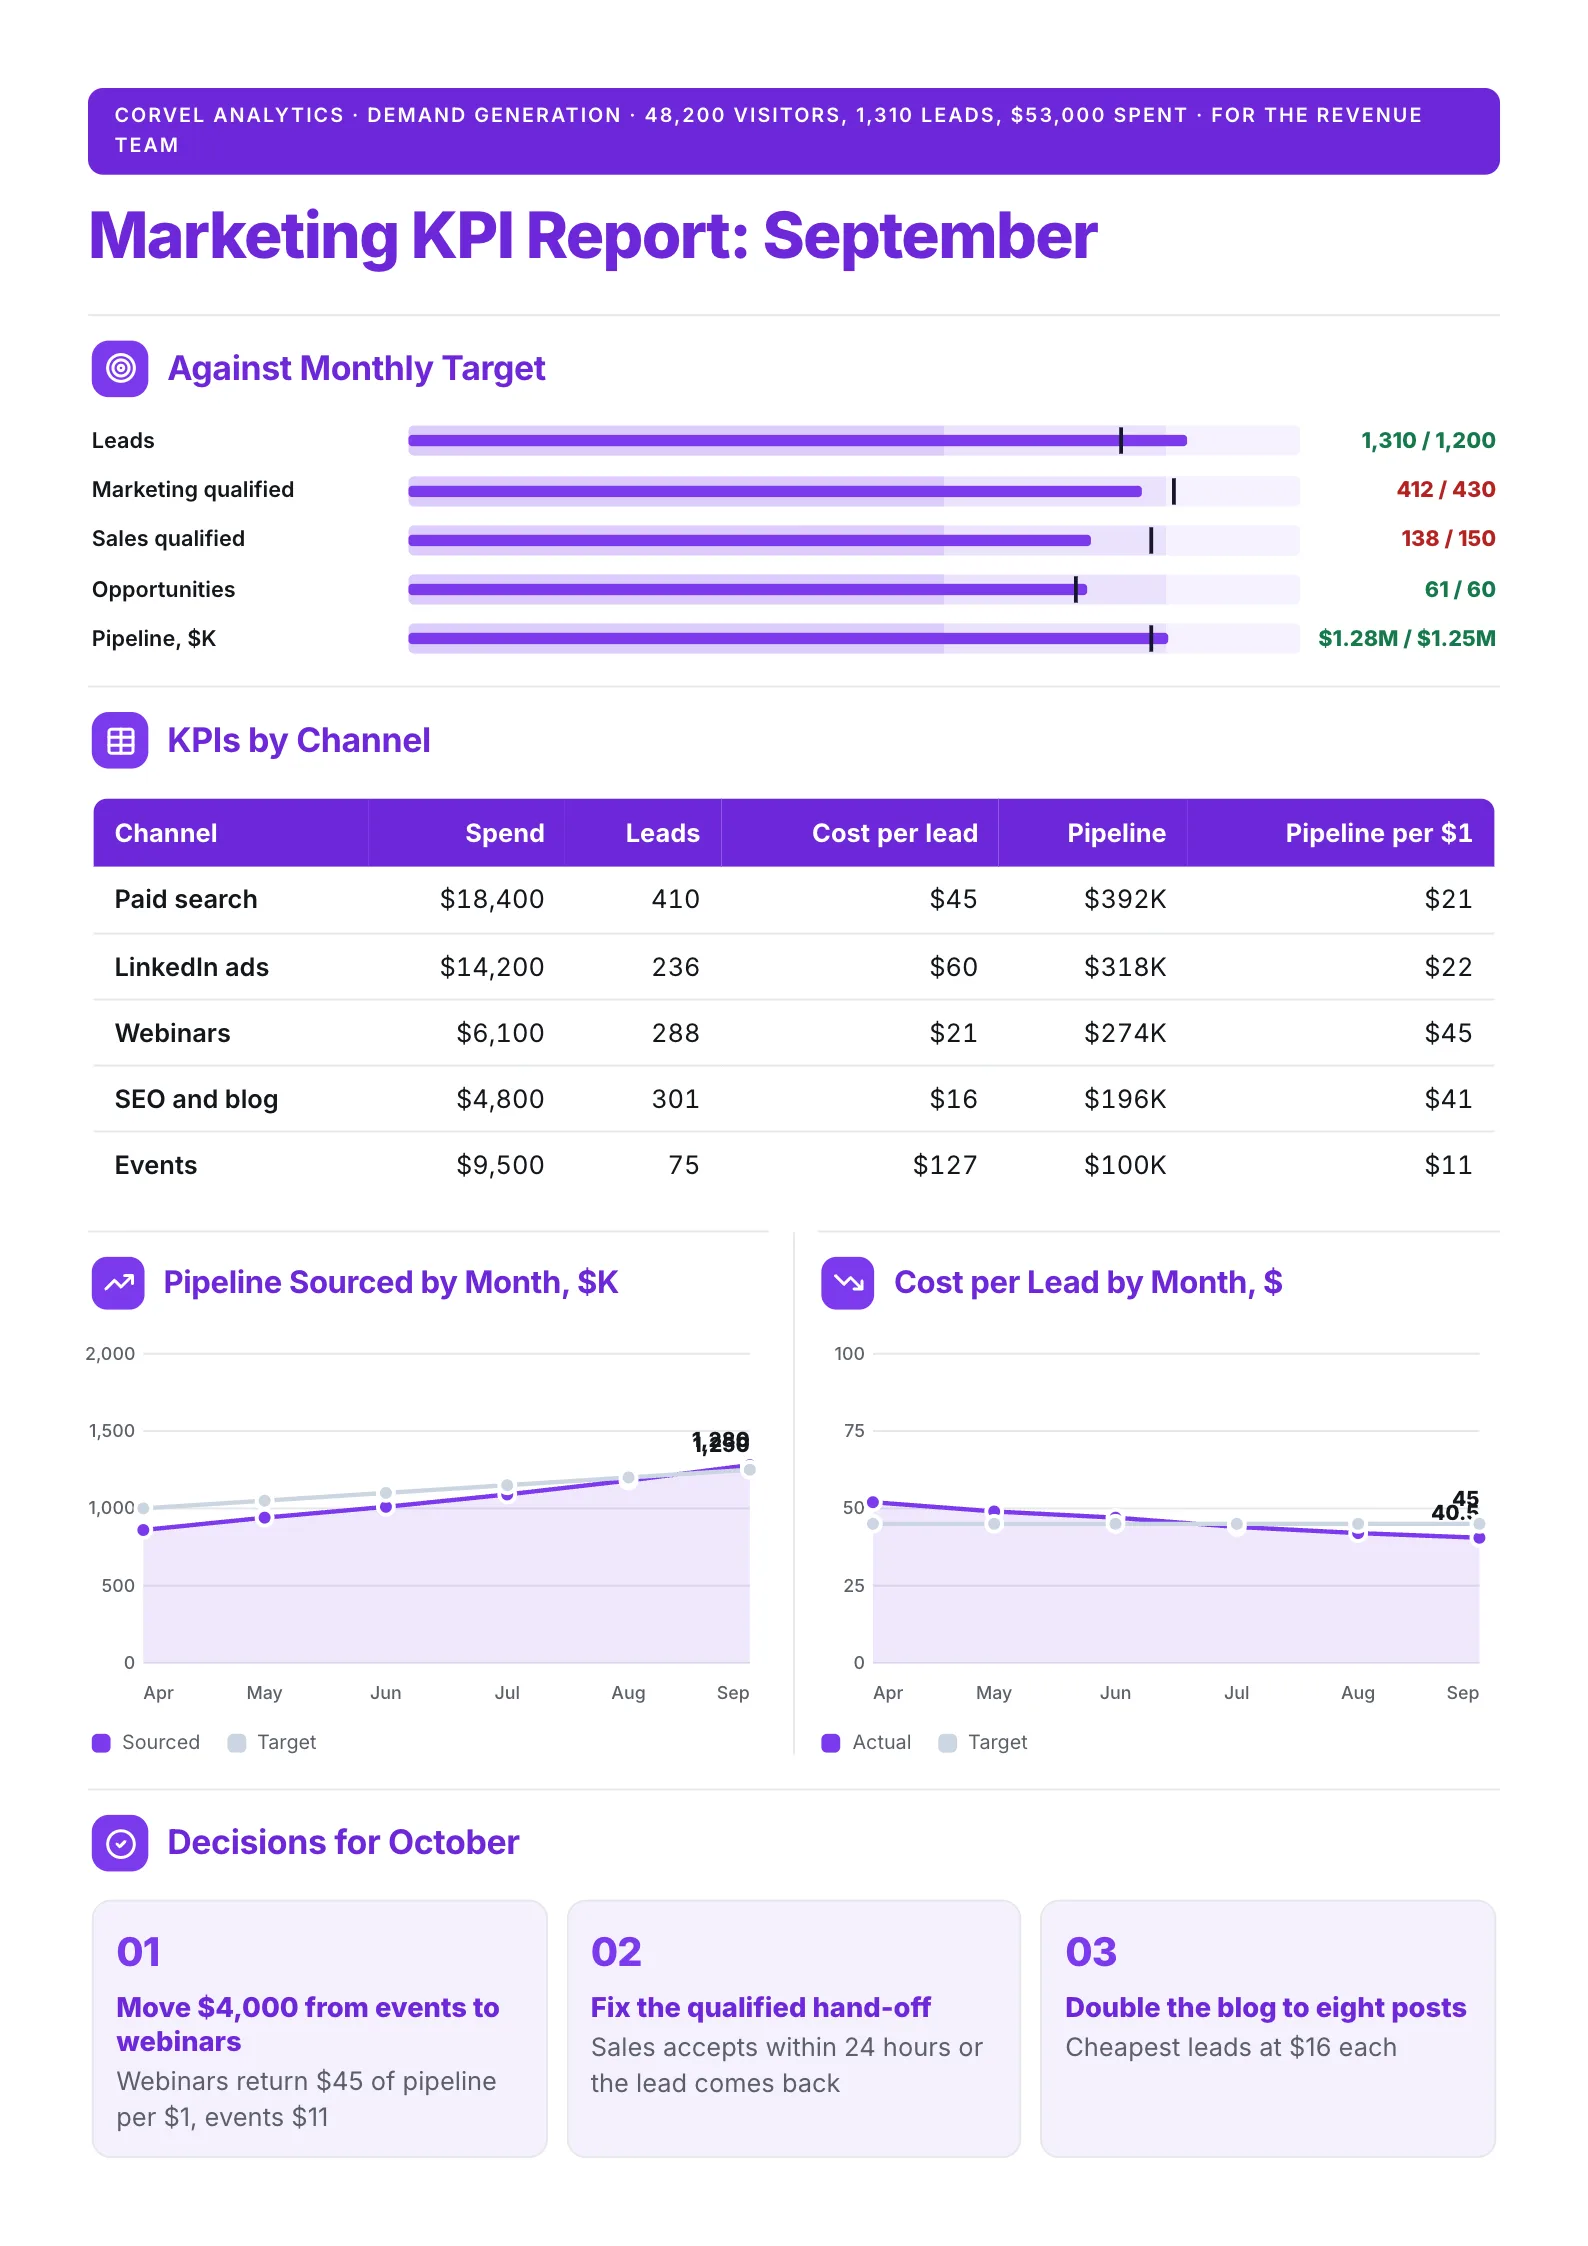
A demand team's month, from leads to pipeline, with every channel's cost beside its return.
What to copy:
- The funnel against target. 1,310 leads against 1,200, but 138 sales qualified against 150.
- Return per dollar by channel. Webinars return $45 of pipeline per $1, events $11.
- Decisions, not observations. Move $4,000 from events to webinars in October.
Edit for free: marketing KPI report template.
5. Warehouse fulfillment KPI report
 Edit this template
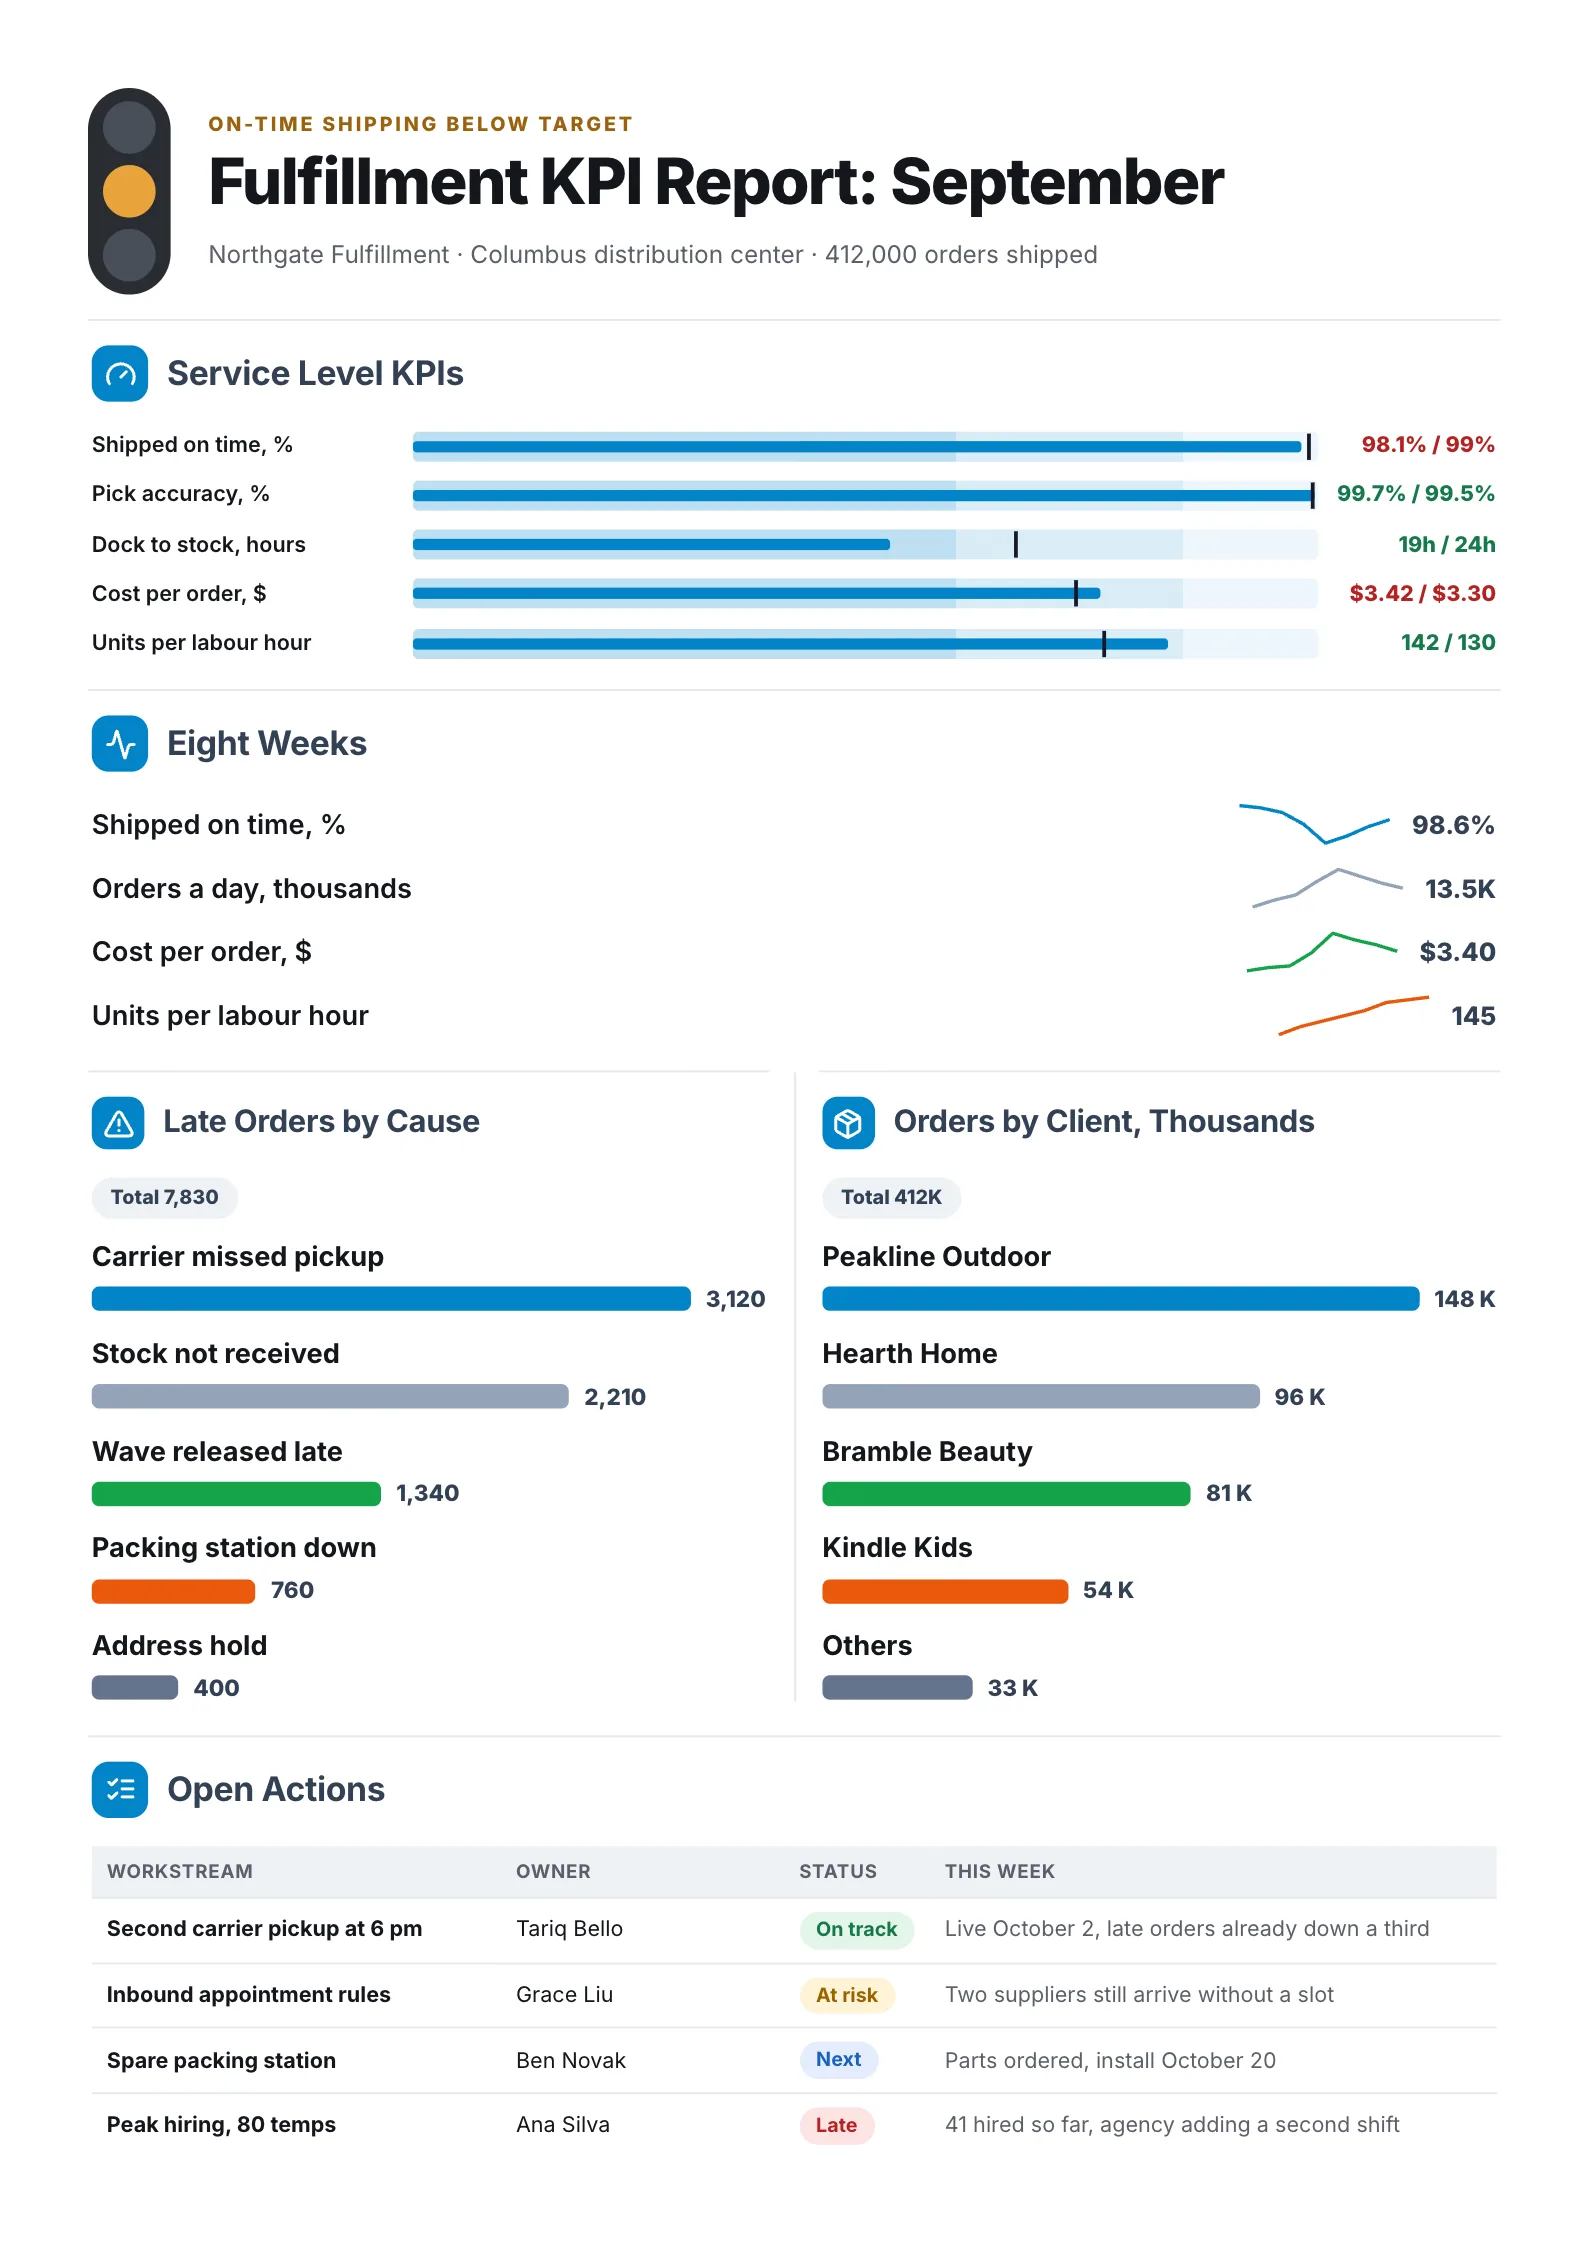
A distribution center's month: service against target, then why orders went out late.
What to copy:
- Wins and misses side by side. Pick accuracy 99.7% beat its 99.5% target. On time at 98.1% missed 99%.
- Late orders split by cause. All 7,830, from a missed carrier pickup to an address hold.
- Open actions with names and status. A second carrier pickup at 6 pm, owned by Tariq Bello, live October 2.
Edit for free: warehouse fulfillment KPI report template.
Other KPI report examples
- OKR scorecard: when the KPIs are key results under a few quarterly objectives.
- Weekly store sales: a retail KPI report with sales, traffic and conversion by store.
- E-commerce monthly report: orders, conversion and average order value for an online shop.
How to choose the KPIs
Most KPI reports fail before anyone opens them, because the wrong KPIs were chosen. Four tests help:
- Tied to a goal. If nobody can say which goal a KPI serves, drop it.
- Has a target. A number without a target cannot be on or off track.
- Someone owns it. One person who can explain it and act on it.
- Moves within the period. A KPI that changes once a year does not belong in a monthly report.
Then limit the report to four to six. If a team needs fifteen numbers, put the other ten in the appendix or the dashboard, and keep the report for the ones leadership decides on.
KPI report vs KPI dashboard
| KPI dashboard | KPI report | |
|---|---|---|
| Updated | Live or daily | Weekly, monthly or quarterly |
| Shows | Many measures, for checking | A few KPIs, for deciding |
| Explains | Rarely | The reasons behind misses |
| Ends with | Nothing | Actions with owners |
A dashboard is for watching. A report is for the meeting where someone decides.
How to write a KPI report in 6 steps
- Pull the period's values for your four to six KPIs, with last period and the target.
- Mark each one on target, near or off.
- Chart the trend for the KPI that matters most.
- Break down the biggest miss into its causes.
- Write one action per cause, with an owner and a status.
- Add a note on how each KPI is calculated, so nobody argues about definitions.
If your numbers already sit in a spreadsheet export or a long report as a PDF, the free AI One-Pager generator reads a PDF, Word or PowerPoint file and gives it back as a designed One-Pager. Check every figure against the source before you share it.
KPI report mistakes
- Too many KPIs. Twenty numbers means nothing is a priority.
- No targets. "93.5% on time" is meaningless without "target 95%".
- Green everywhere. If every KPI is always on target, the targets are too easy or the KPIs are wrong.
- No reason for misses. A red number with no explanation starts an argument, not a fix.
- Actions with no owner. "Improve changeovers" will not happen. "Quick-change molds on Line 3, owned by the line lead" might.
- Changing definitions. If scrap was measured by weight last month and by count this month, say so, or compare like with like.
Make your KPI report
Open the free manufacturing KPI dashboard template and replace the plant's KPIs with yours, or drop your numbers into the free AI One-Pager generator and get a finished KPI report back.
Frequently asked questions
What should a KPI report include?
The period, four to six KPIs each with its value, target and change, a status for each, a trend for the main KPI, the reasons behind the misses and actions with owners.
How many KPIs should a report have?
Four to six for a team report. A board report may have a few more if they are grouped by area, but each extra KPI makes the others harder to see.
How often should KPIs be reported?
As often as the team can act on them. Weekly for sales and support, monthly for operations, finance and marketing, quarterly for a board.
What is a good KPI report format?
One page: the KPIs against target at the top, the trend and the breakdown in the middle, actions at the bottom. Excel or a BI tool is good for the data; a one-page report is good for the meeting.