BlogGuide
Financial Summary Template: Free One-Page Financial Summary
A free one-page financial summary template, the numbers and ratios to include, a worked five-year example with the margins worked out and the mistakes to avoid.

By MakeOnepagers Team
Updated · 9 min read

A financial summary template turns a full set of accounts into one page a board, an investor, a lender or a new manager can read in two minutes. The income statement, balance sheet and cash flow statement stay where they are. The summary pulls out the handful of numbers that matter, shows how they have moved and says what that movement means. Below are the numbers and ratios to include, a free financial summary template you can copy, a worked five-year example with the arithmetic shown, five financial summary examples and the mistakes that make a summary harder to read than the accounts.
One‑Pager examples
Real One-Pagers made with MakeOnepagers. Open any one to edit it as your own.
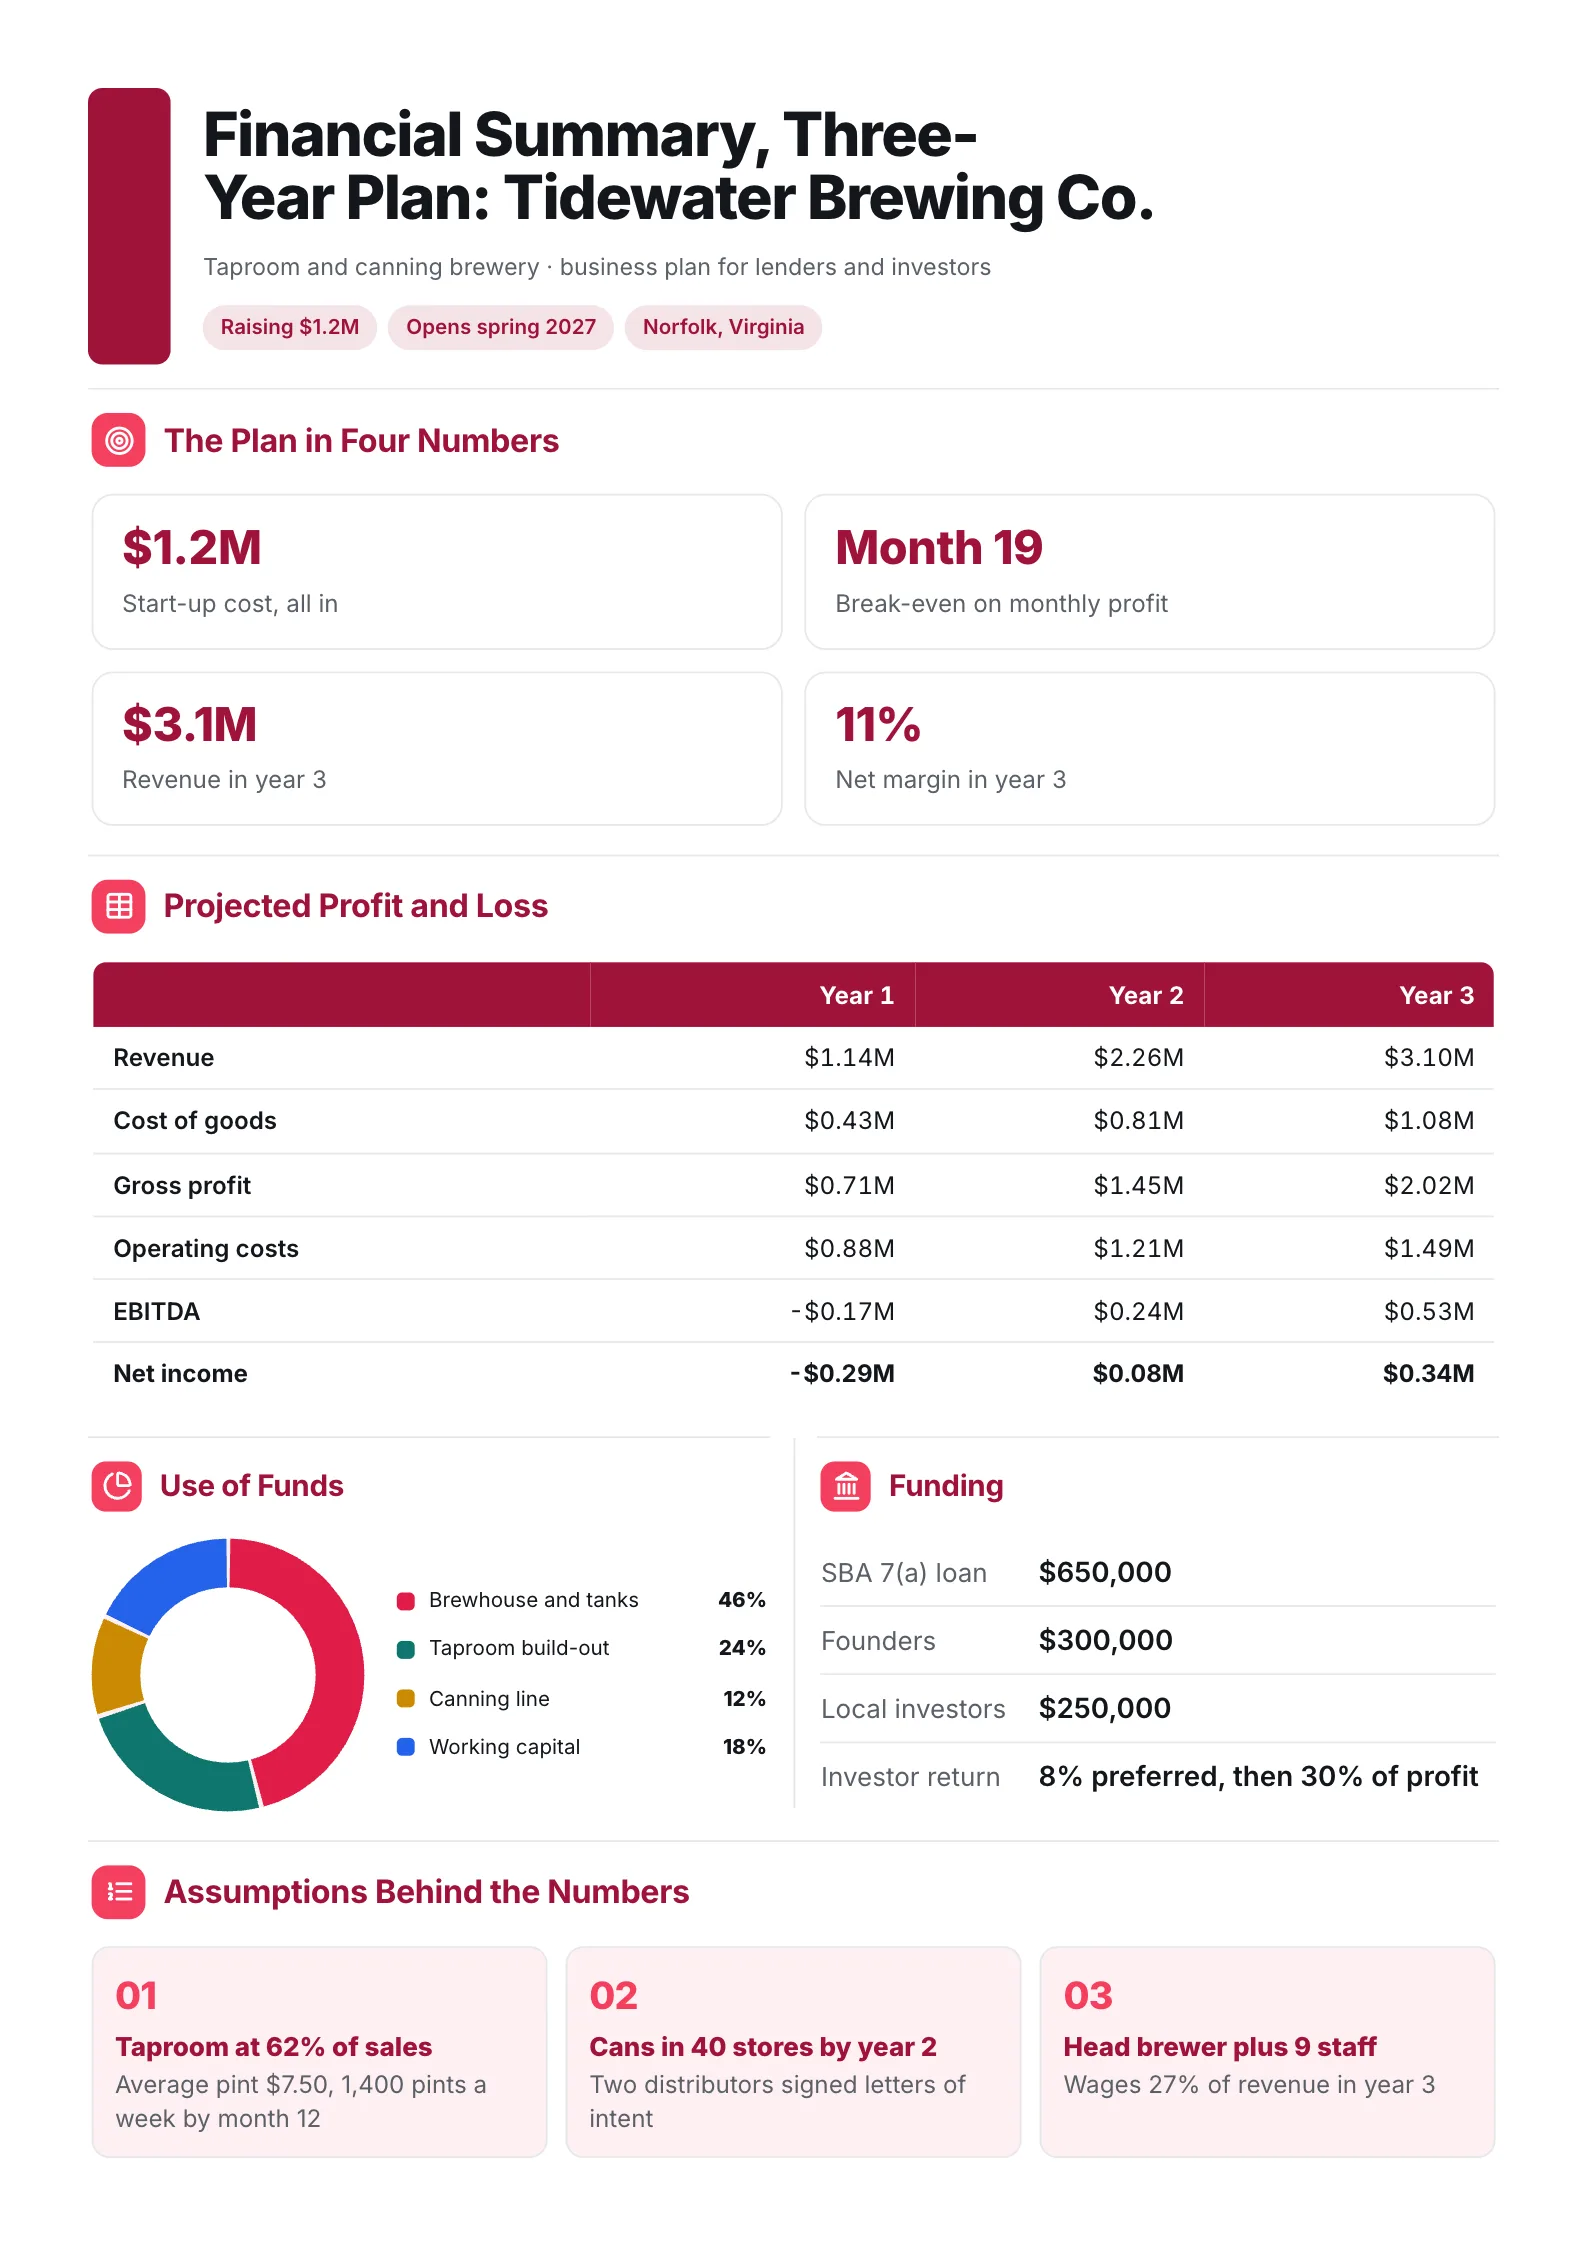 Financial Summary: Brewery Business PlanEdit for free(opens in a new tab)
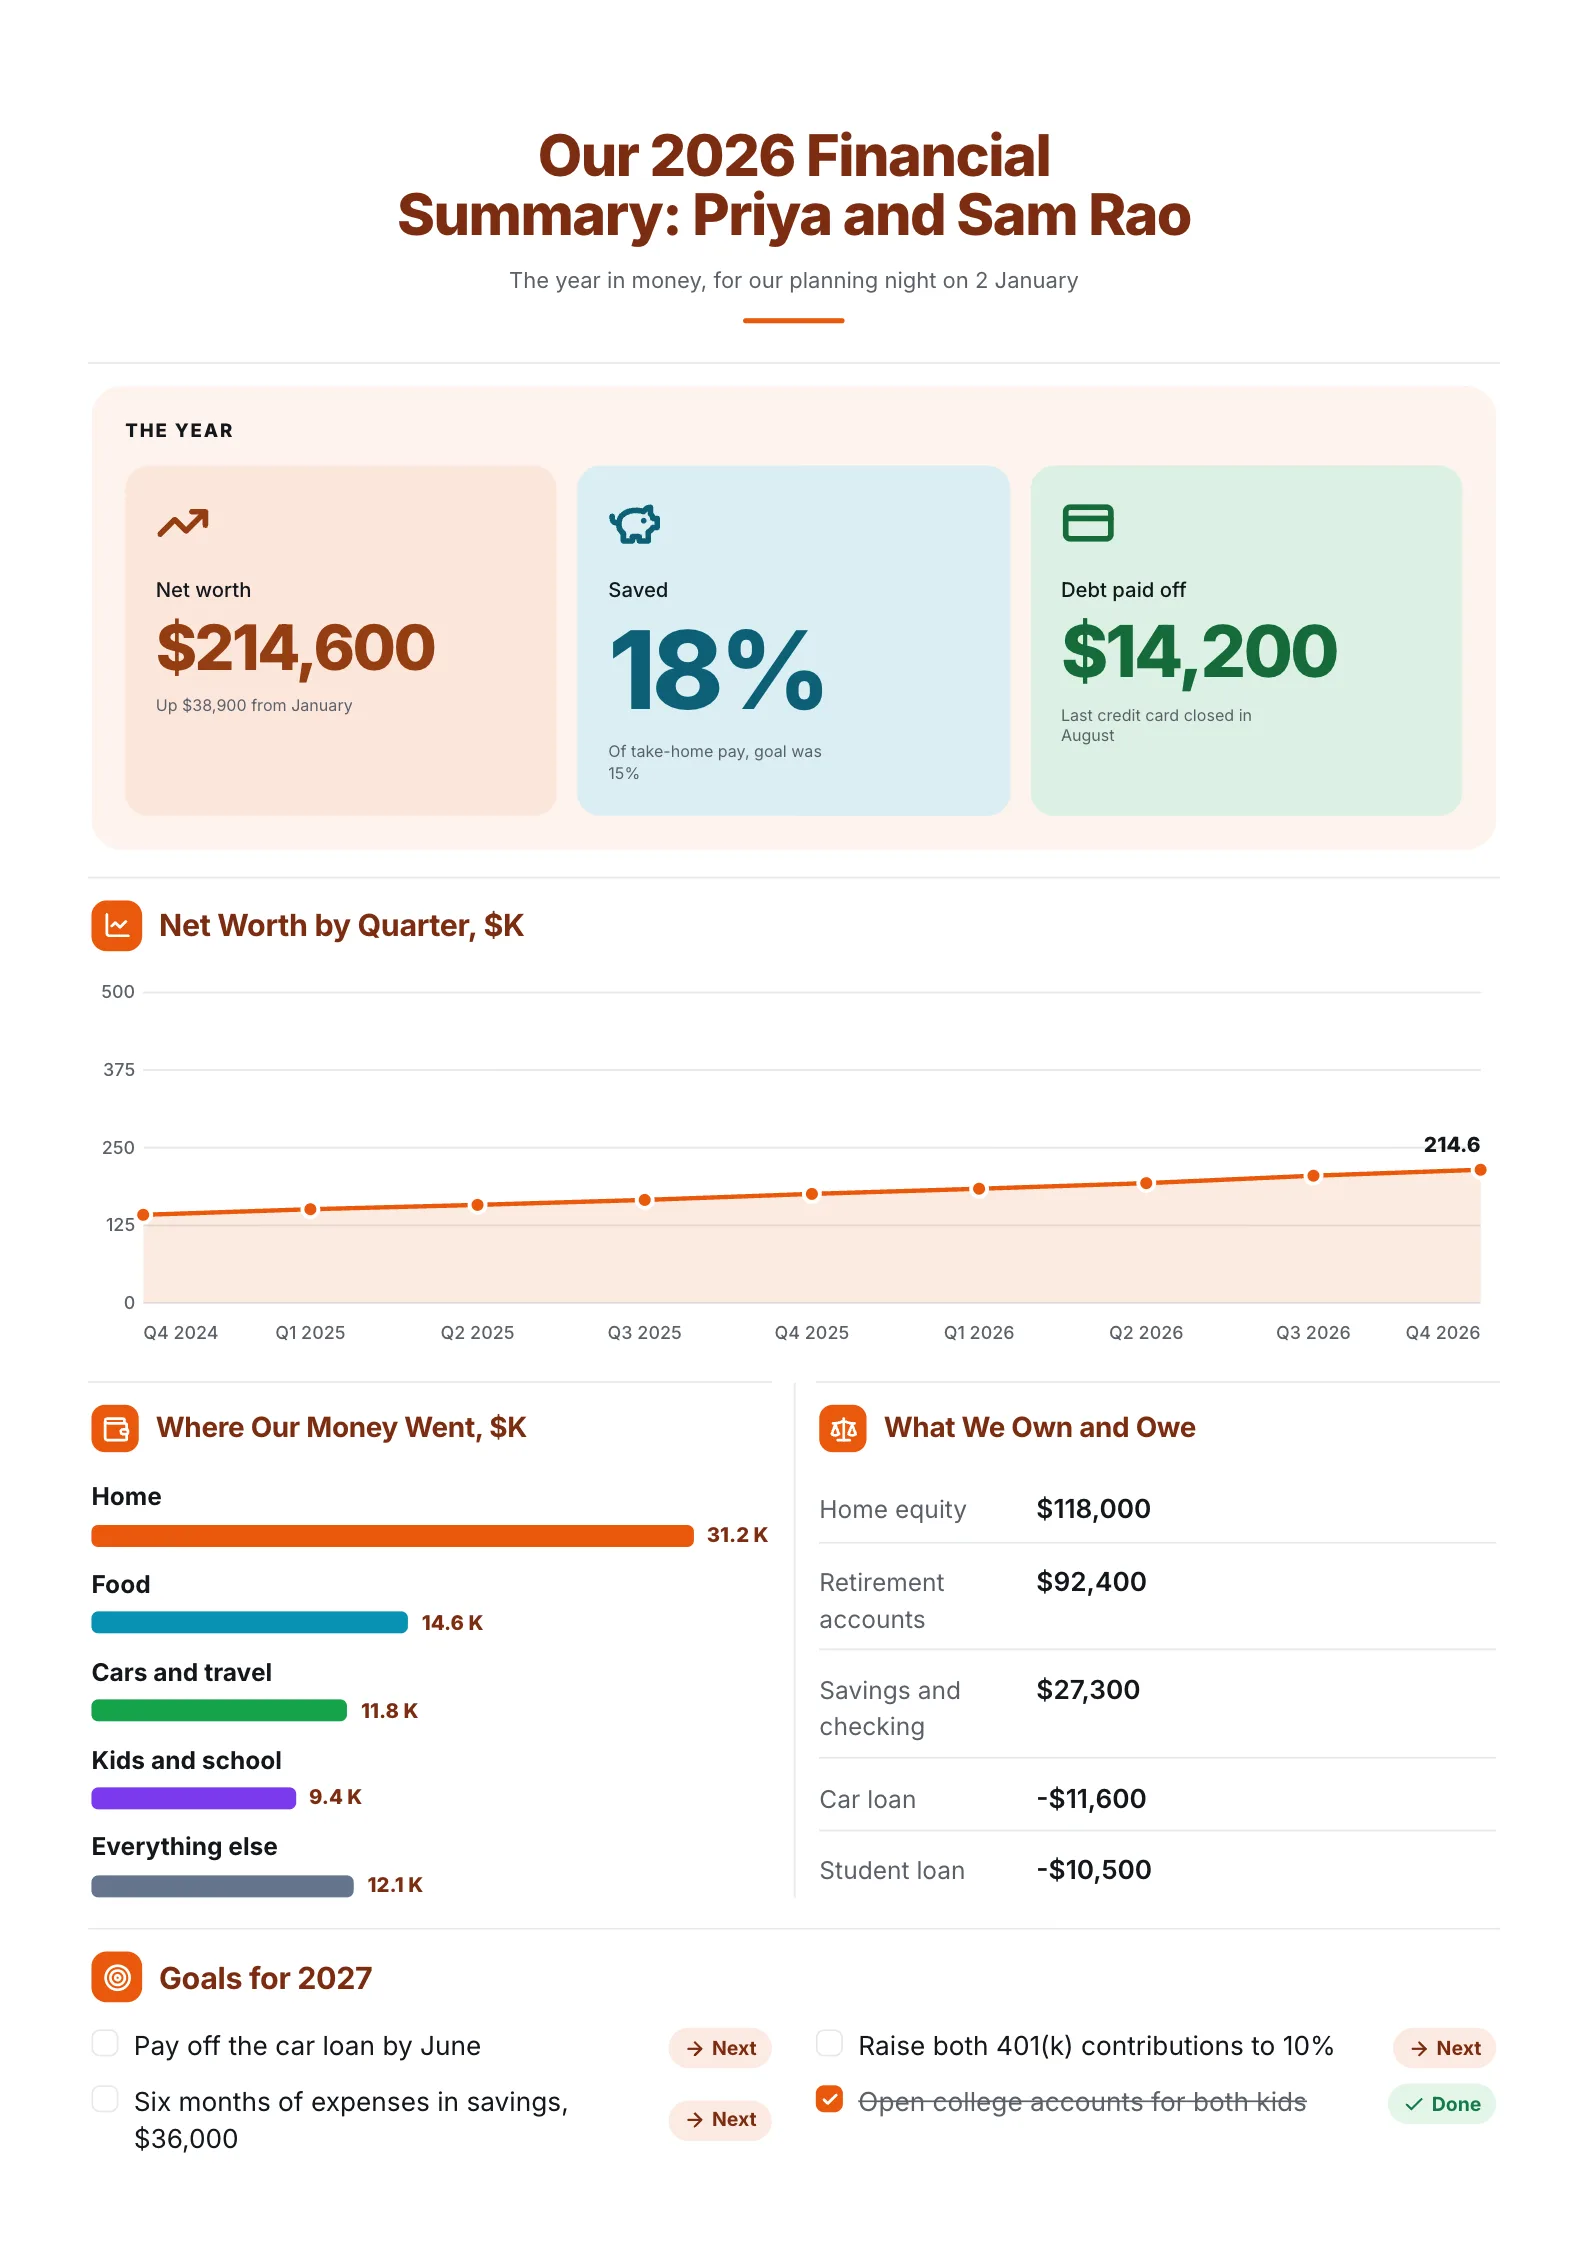 Financial Summary: Household YearEdit for free(opens in a new tab)
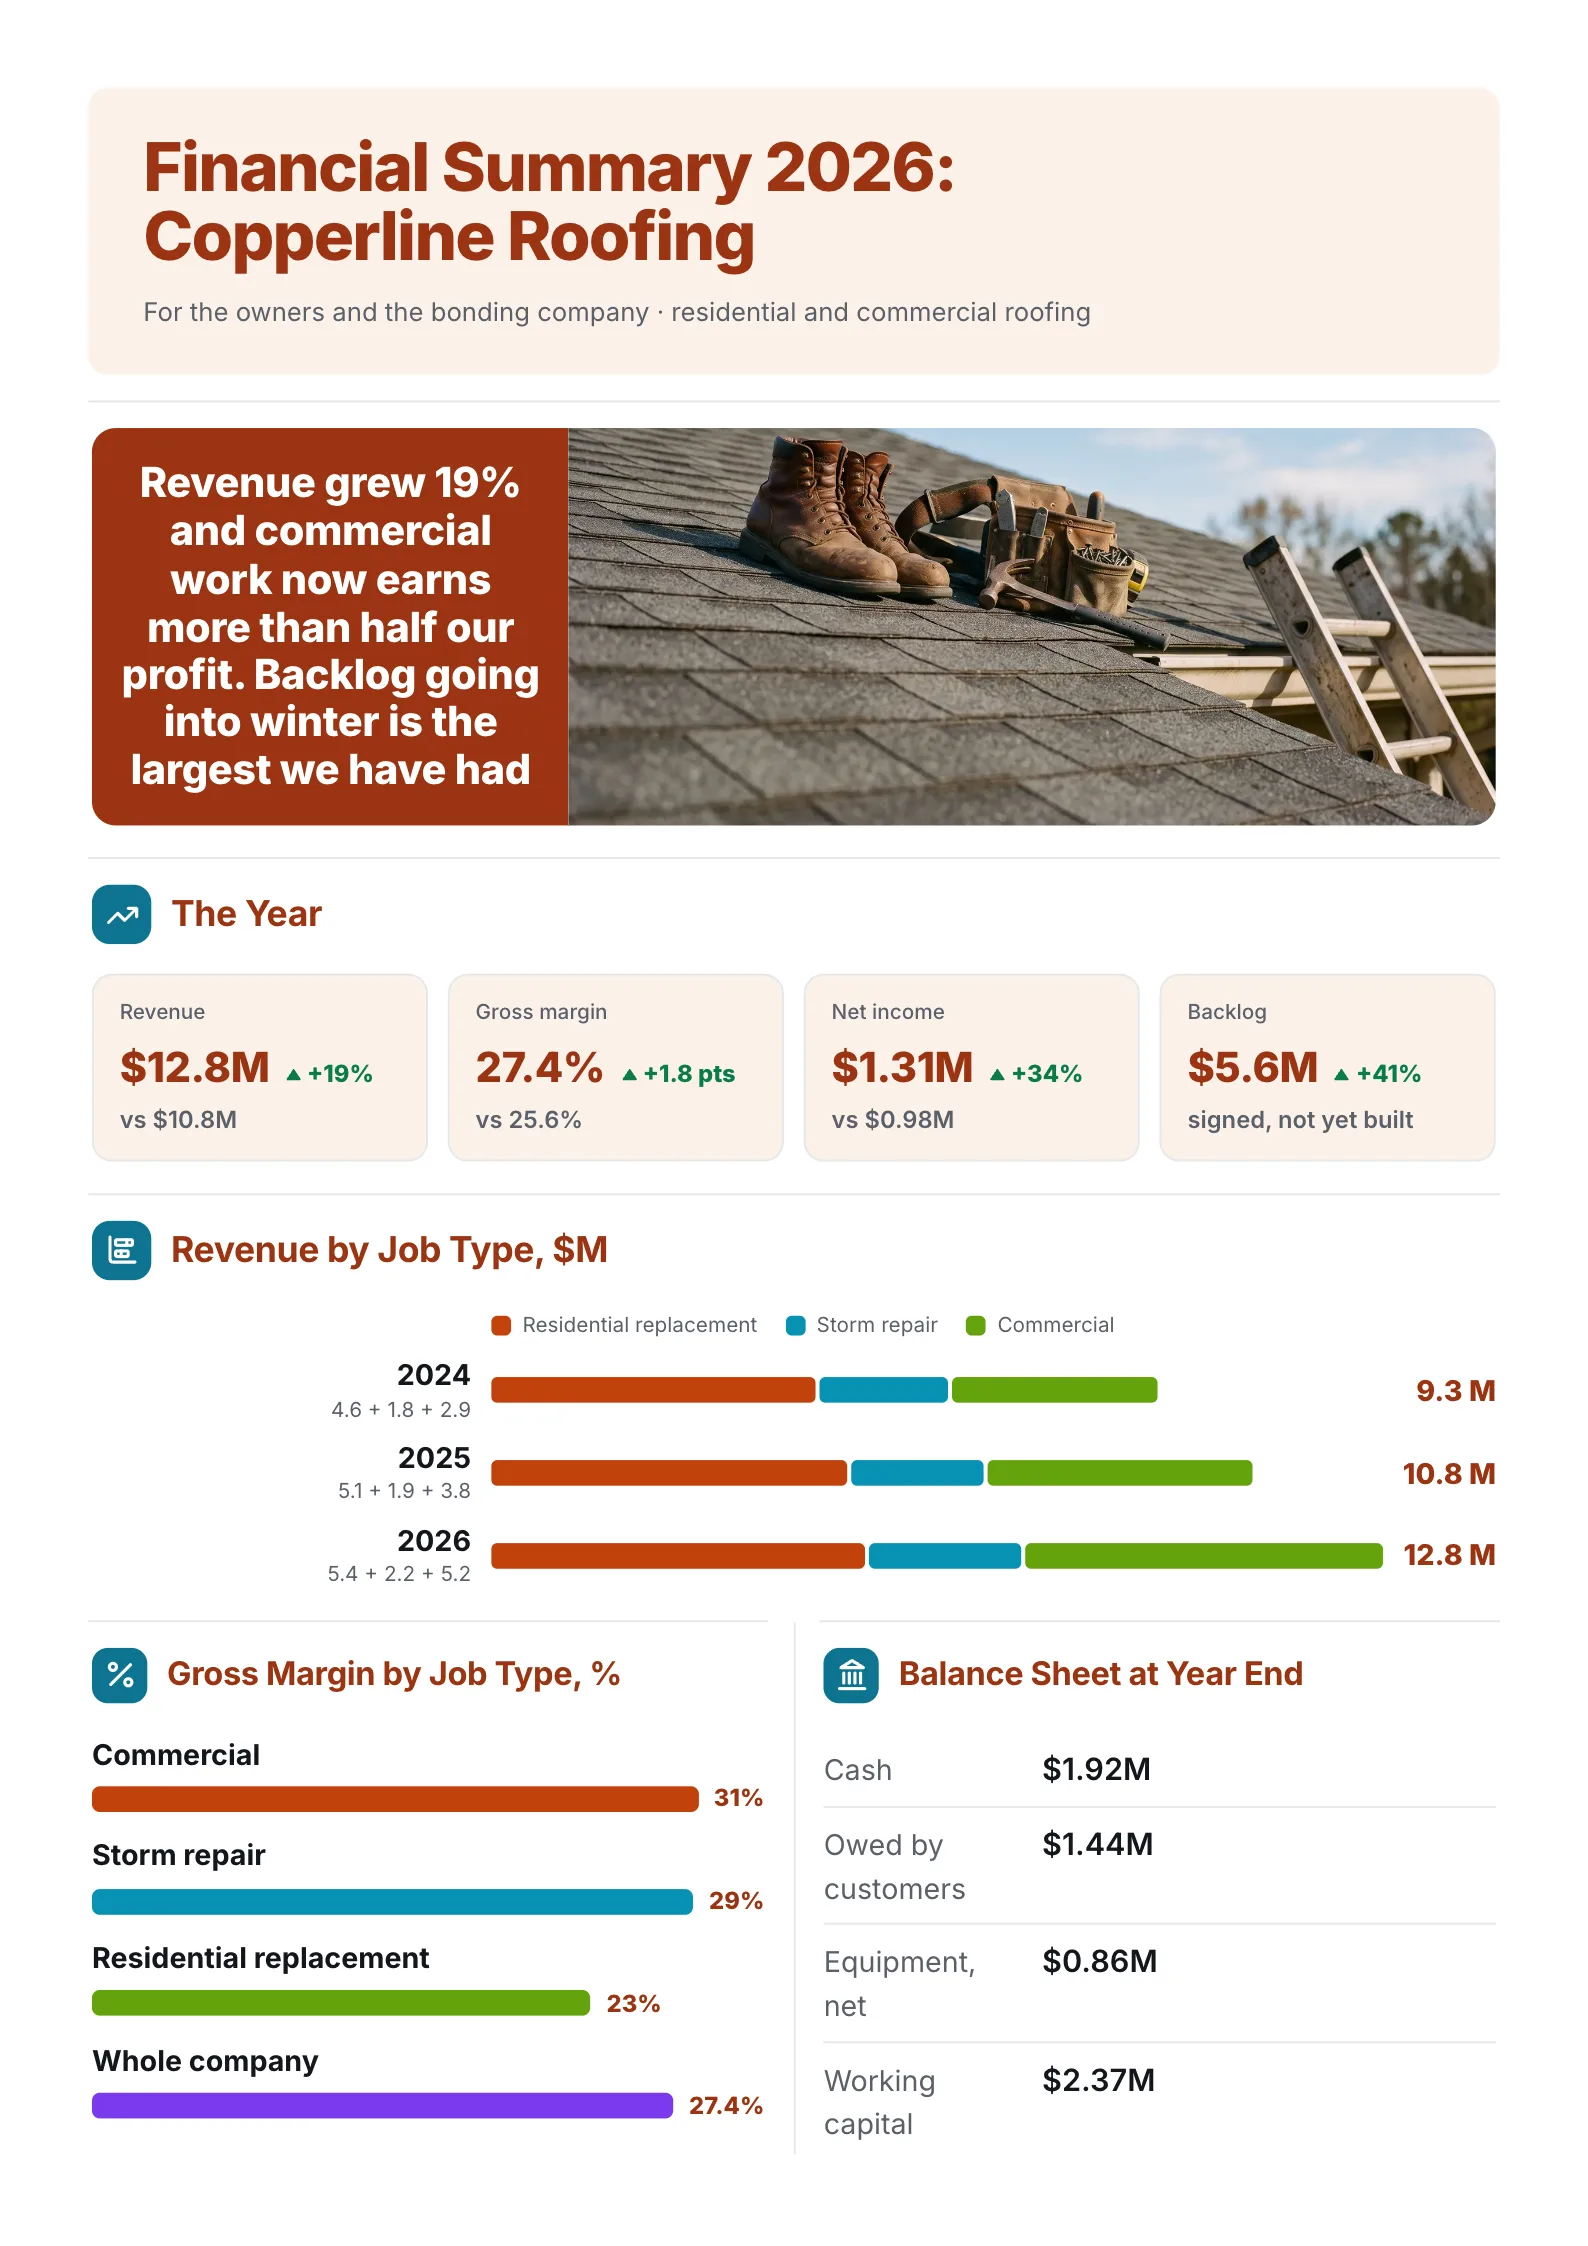 Financial Summary: Roofing Contractor YearEdit for free(opens in a new tab)
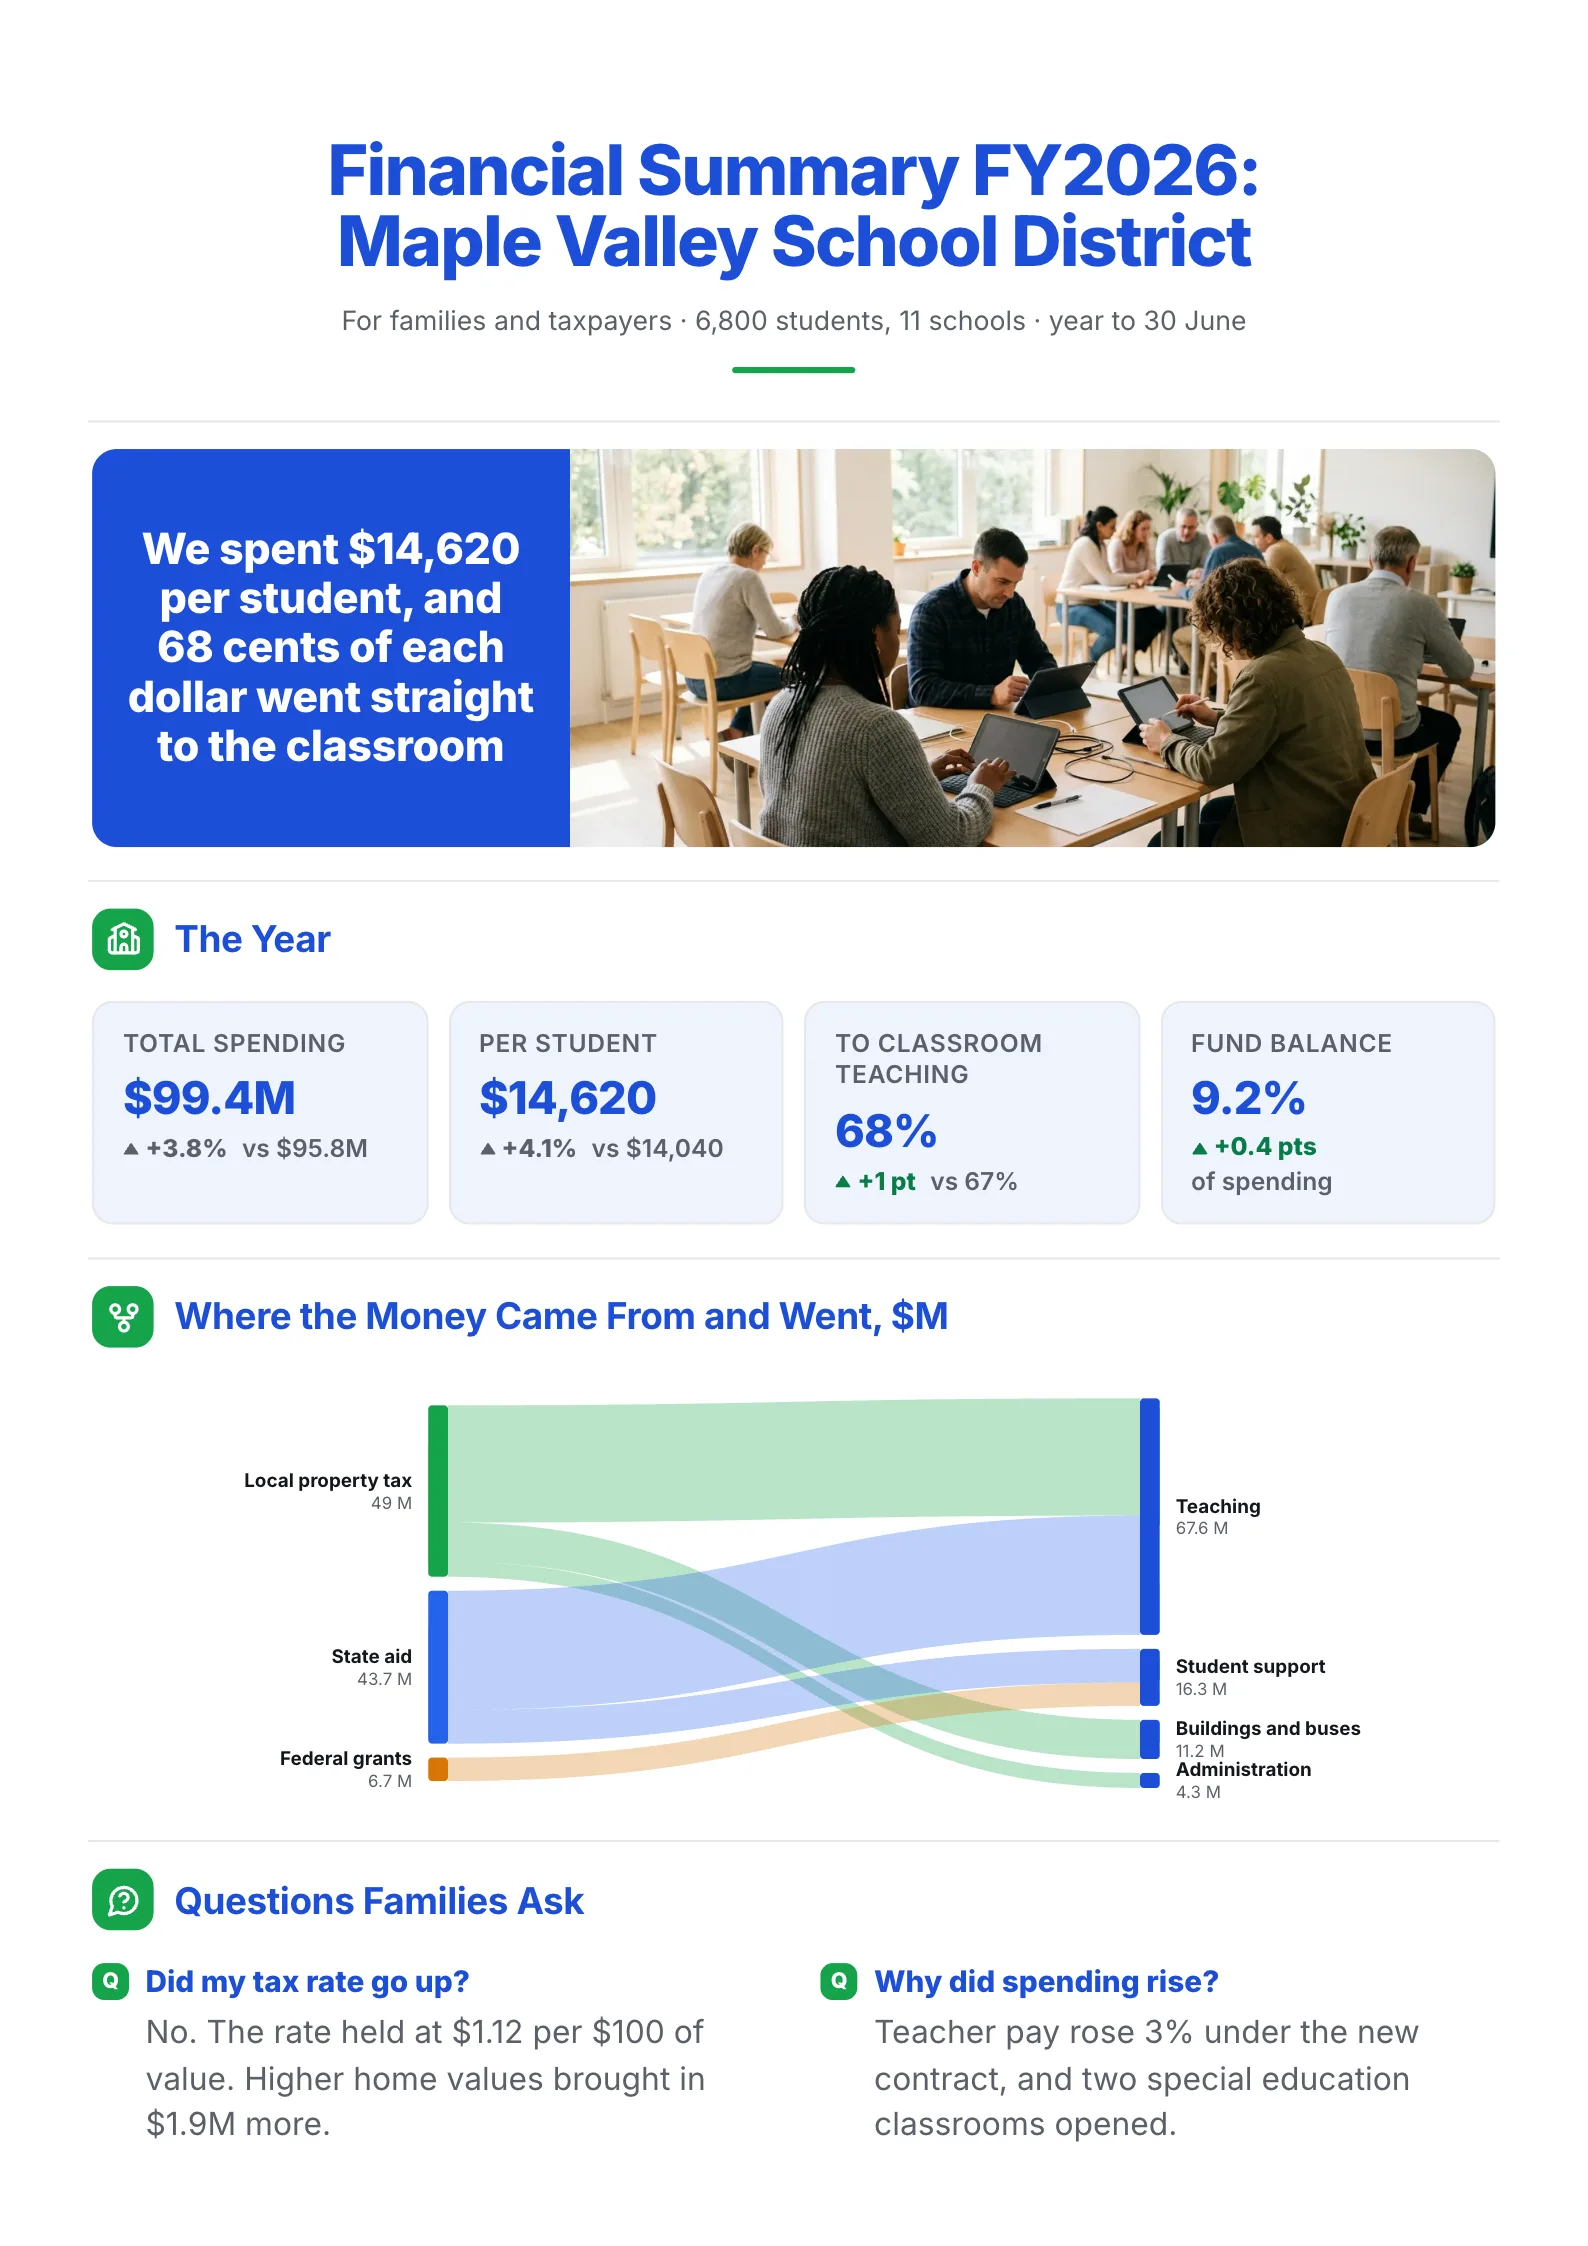 Financial Summary: School District YearEdit for free(opens in a new tab)
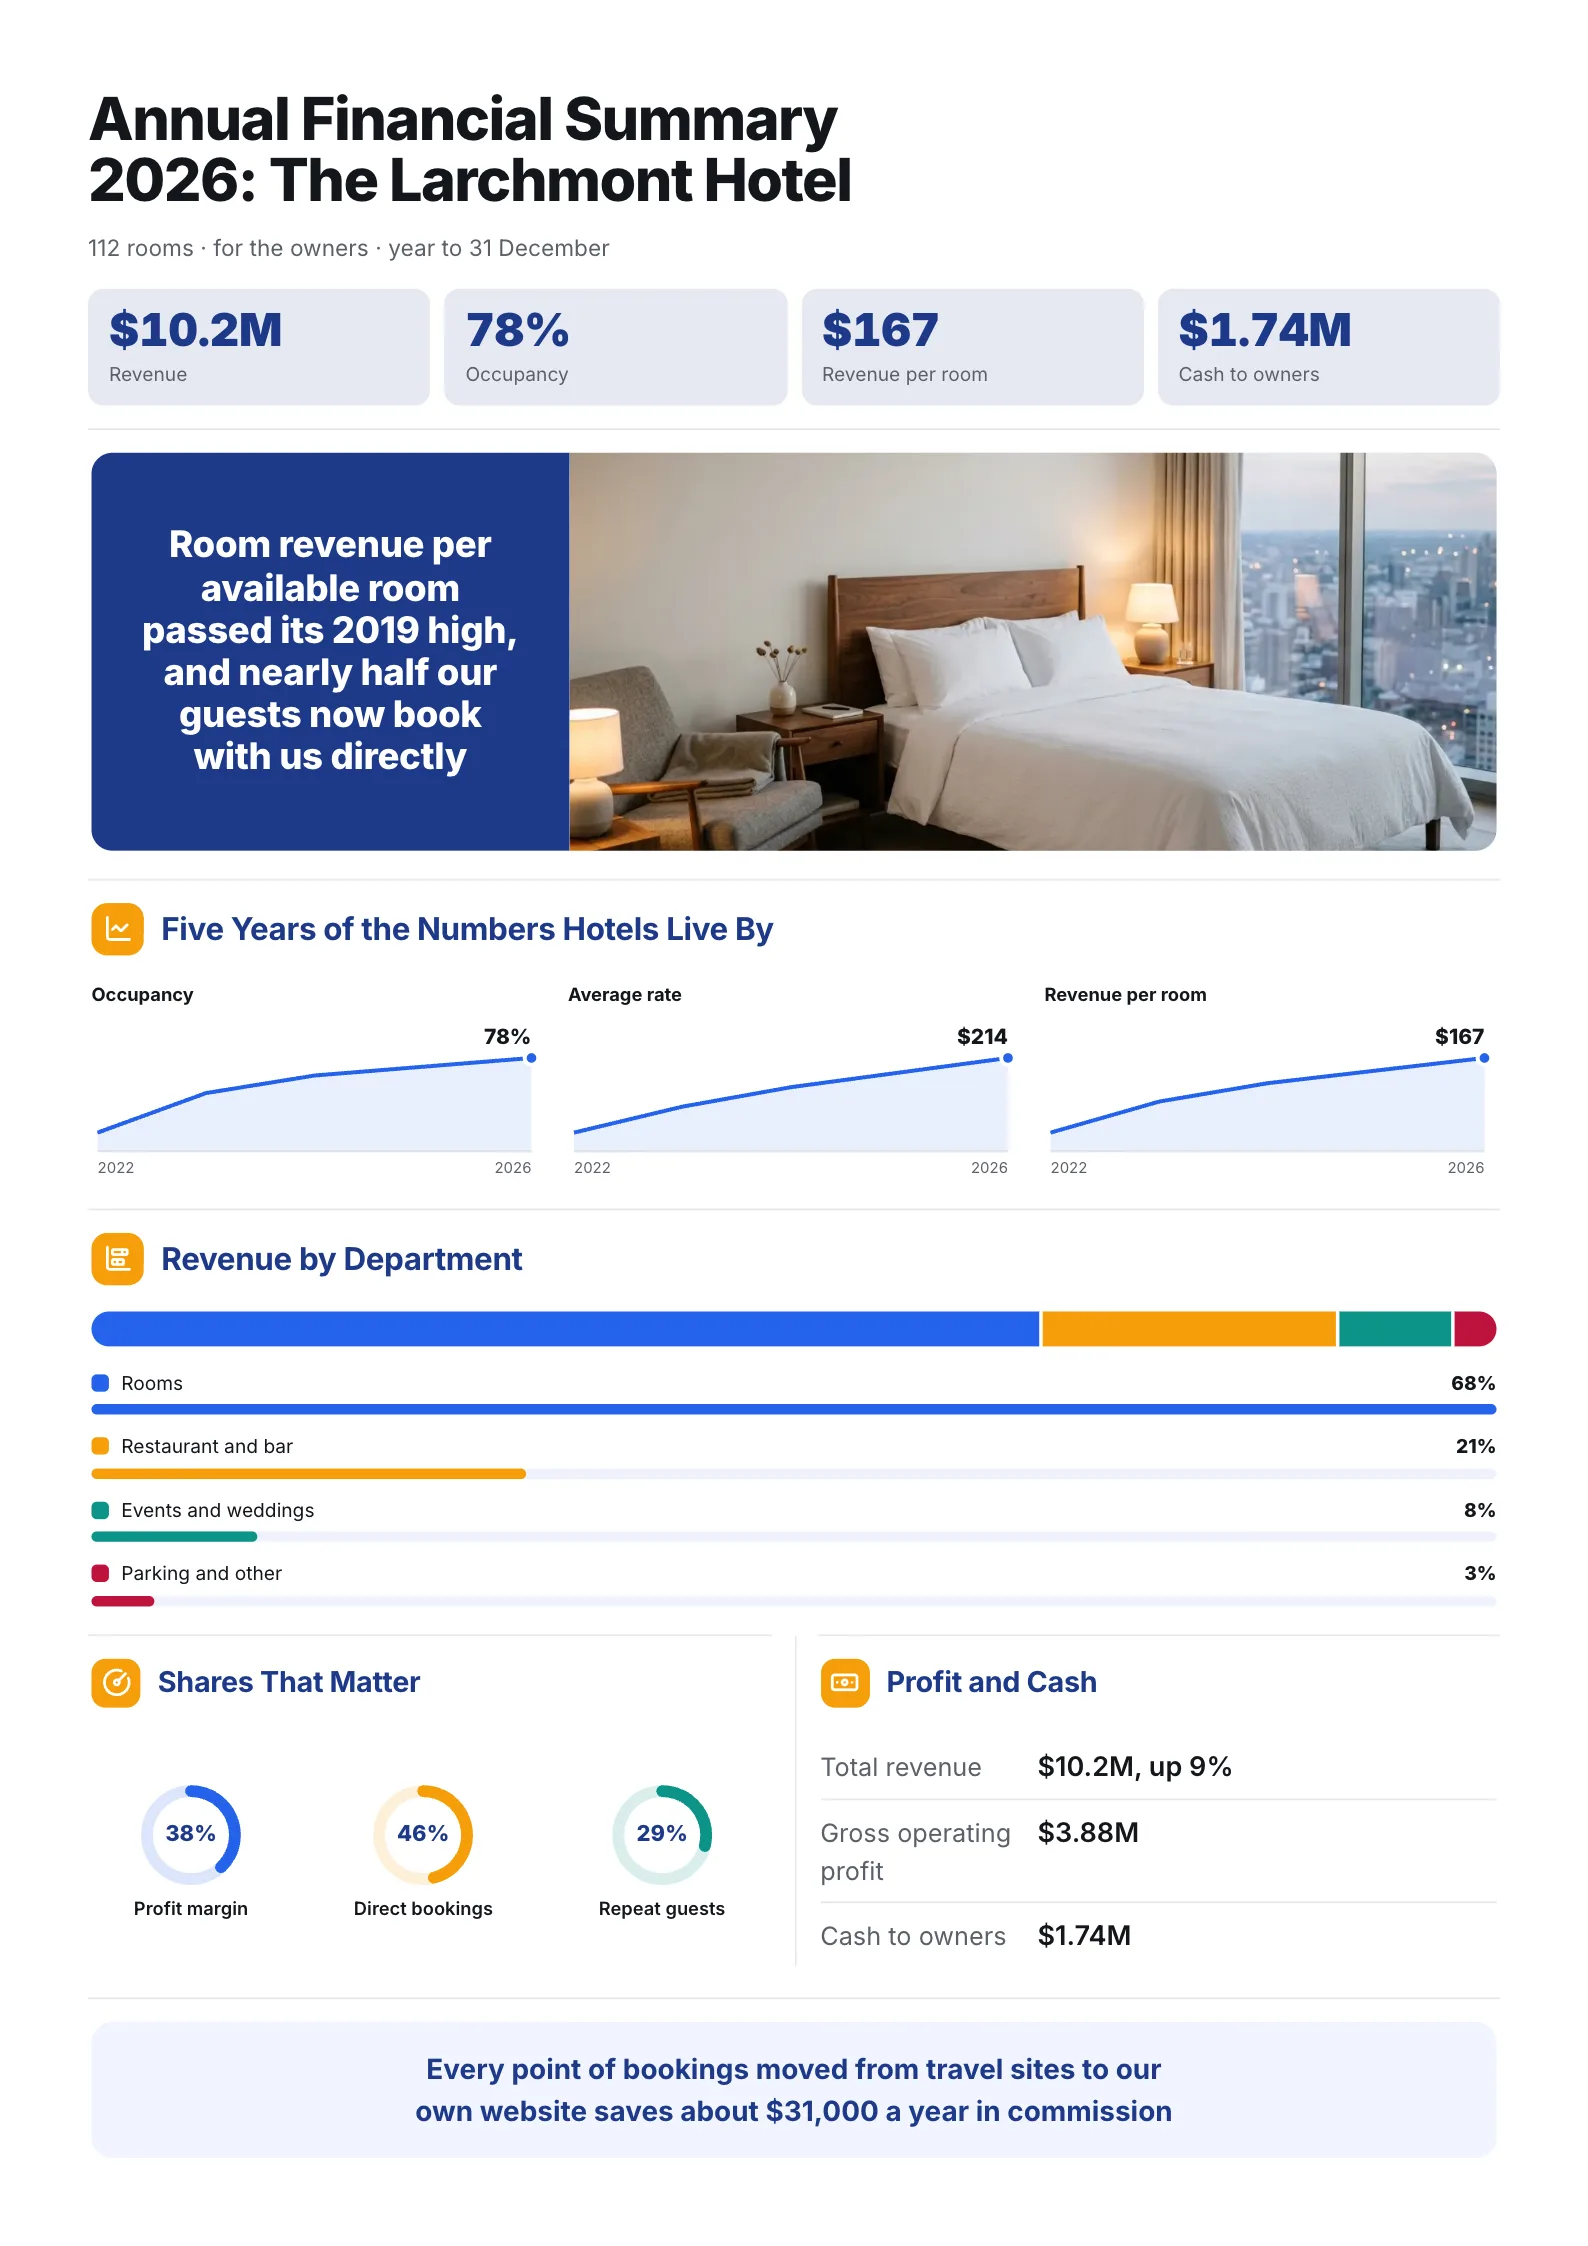 Financial Summary: Hotel YearEdit for free(opens in a new tab)
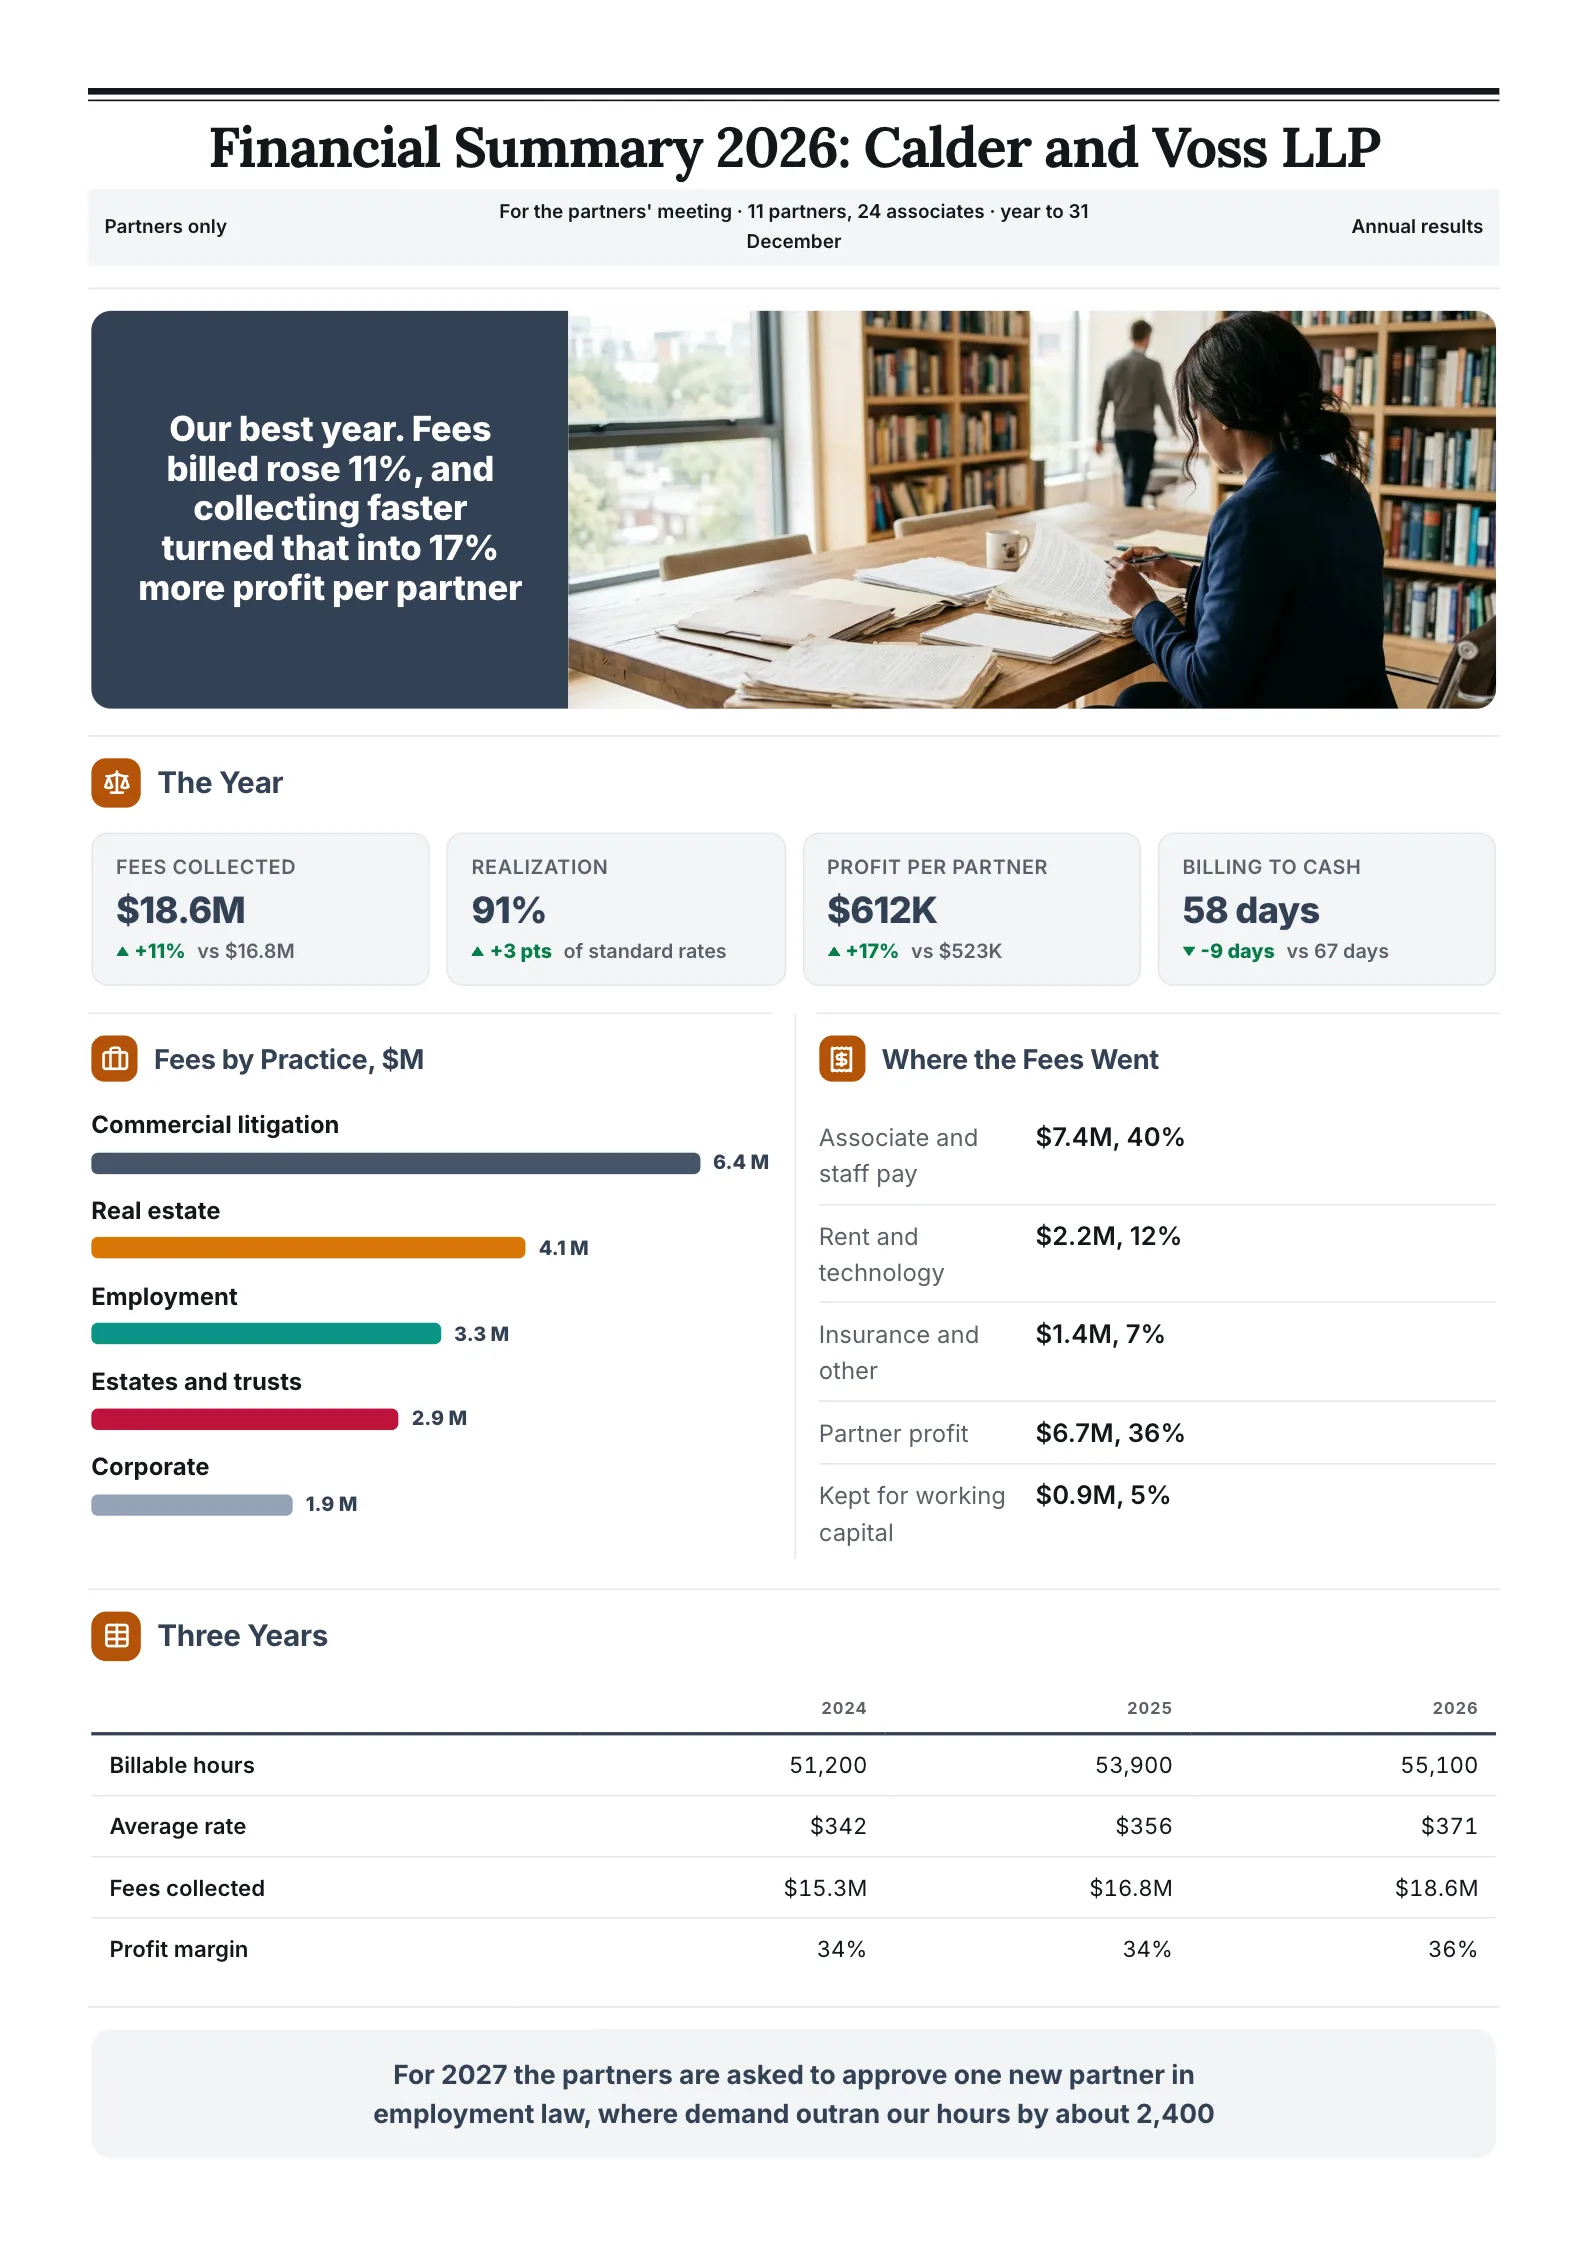 Financial Summary: Law Firm Partners' YearEdit for free(opens in a new tab)
Every example was made with MakeOnepagers. Each one opens as a template you can edit for free: every word, chart and color.
What is a financial summary?
A financial summary is a short overview of a company's financial results for a period, usually a quarter or a year, often with several earlier periods beside it. It sits in front of the full statements in an annual report, a board pack, a business plan, a loan application or an investor update.
It answers four questions:
- How big are we, and are we growing? Revenue and its change.
- Are we making money? Gross profit, operating income or net income, and the margins.
- Do we have cash? Free cash flow, cash on hand, debt.
- Are we using money well? A return measure such as return on investment or return on equity.
It is not a substitute for the statements. It is the part people actually read.
What to include in a financial summary
The headline numbers, each with last period beside it:
- Revenue
- Gross profit or gross margin
- Operating income (also called operating profit or EBIT)
- Net income
- Free cash flow: cash from operations minus capital spending
- Cash and debt at the end of the period
The ratios that explain them, chosen for your business:
- Gross margin = gross profit ÷ revenue
- Operating margin = operating income ÷ revenue
- Net margin = net income ÷ revenue
- Current ratio = current assets ÷ current liabilities, for short-term health
- Debt to equity = total debt ÷ shareholders' equity, for long-term risk
- Return on investment or return on equity, for how well the money is used
A trend: the same few numbers for three to five periods, as small bar charts or a table.
A split, if the business has distinct parts: revenue or profit by segment, region or channel.
One finding: a sentence that tells the reader what the numbers add up to.
Pick five or six headline numbers, not fifteen. If everything is highlighted, nothing is.
A free financial summary template
Copy this into a document, or open one of the examples further down and edit it.
| Part | What to write, with an example |
|---|---|
| Title | Company and period. Financial Highlights, FY2021 to FY2025 |
| For | The board |
| At a glance | Four numbers, each with last year. Revenue $48.6M, up 22% from $39.8M |
| Trend | Three small charts: revenue, operating income, free cash flow, five years |
| Summary table | Each line by year, with the split that matters. of which online |
| Ratios | Margins and returns, this year and last |
| Finding | Online grew from 16% to 33% of revenue in five years |
| Source | Audited or not, the date the figures were closed |
A worked example: five years at an outdoor retailer
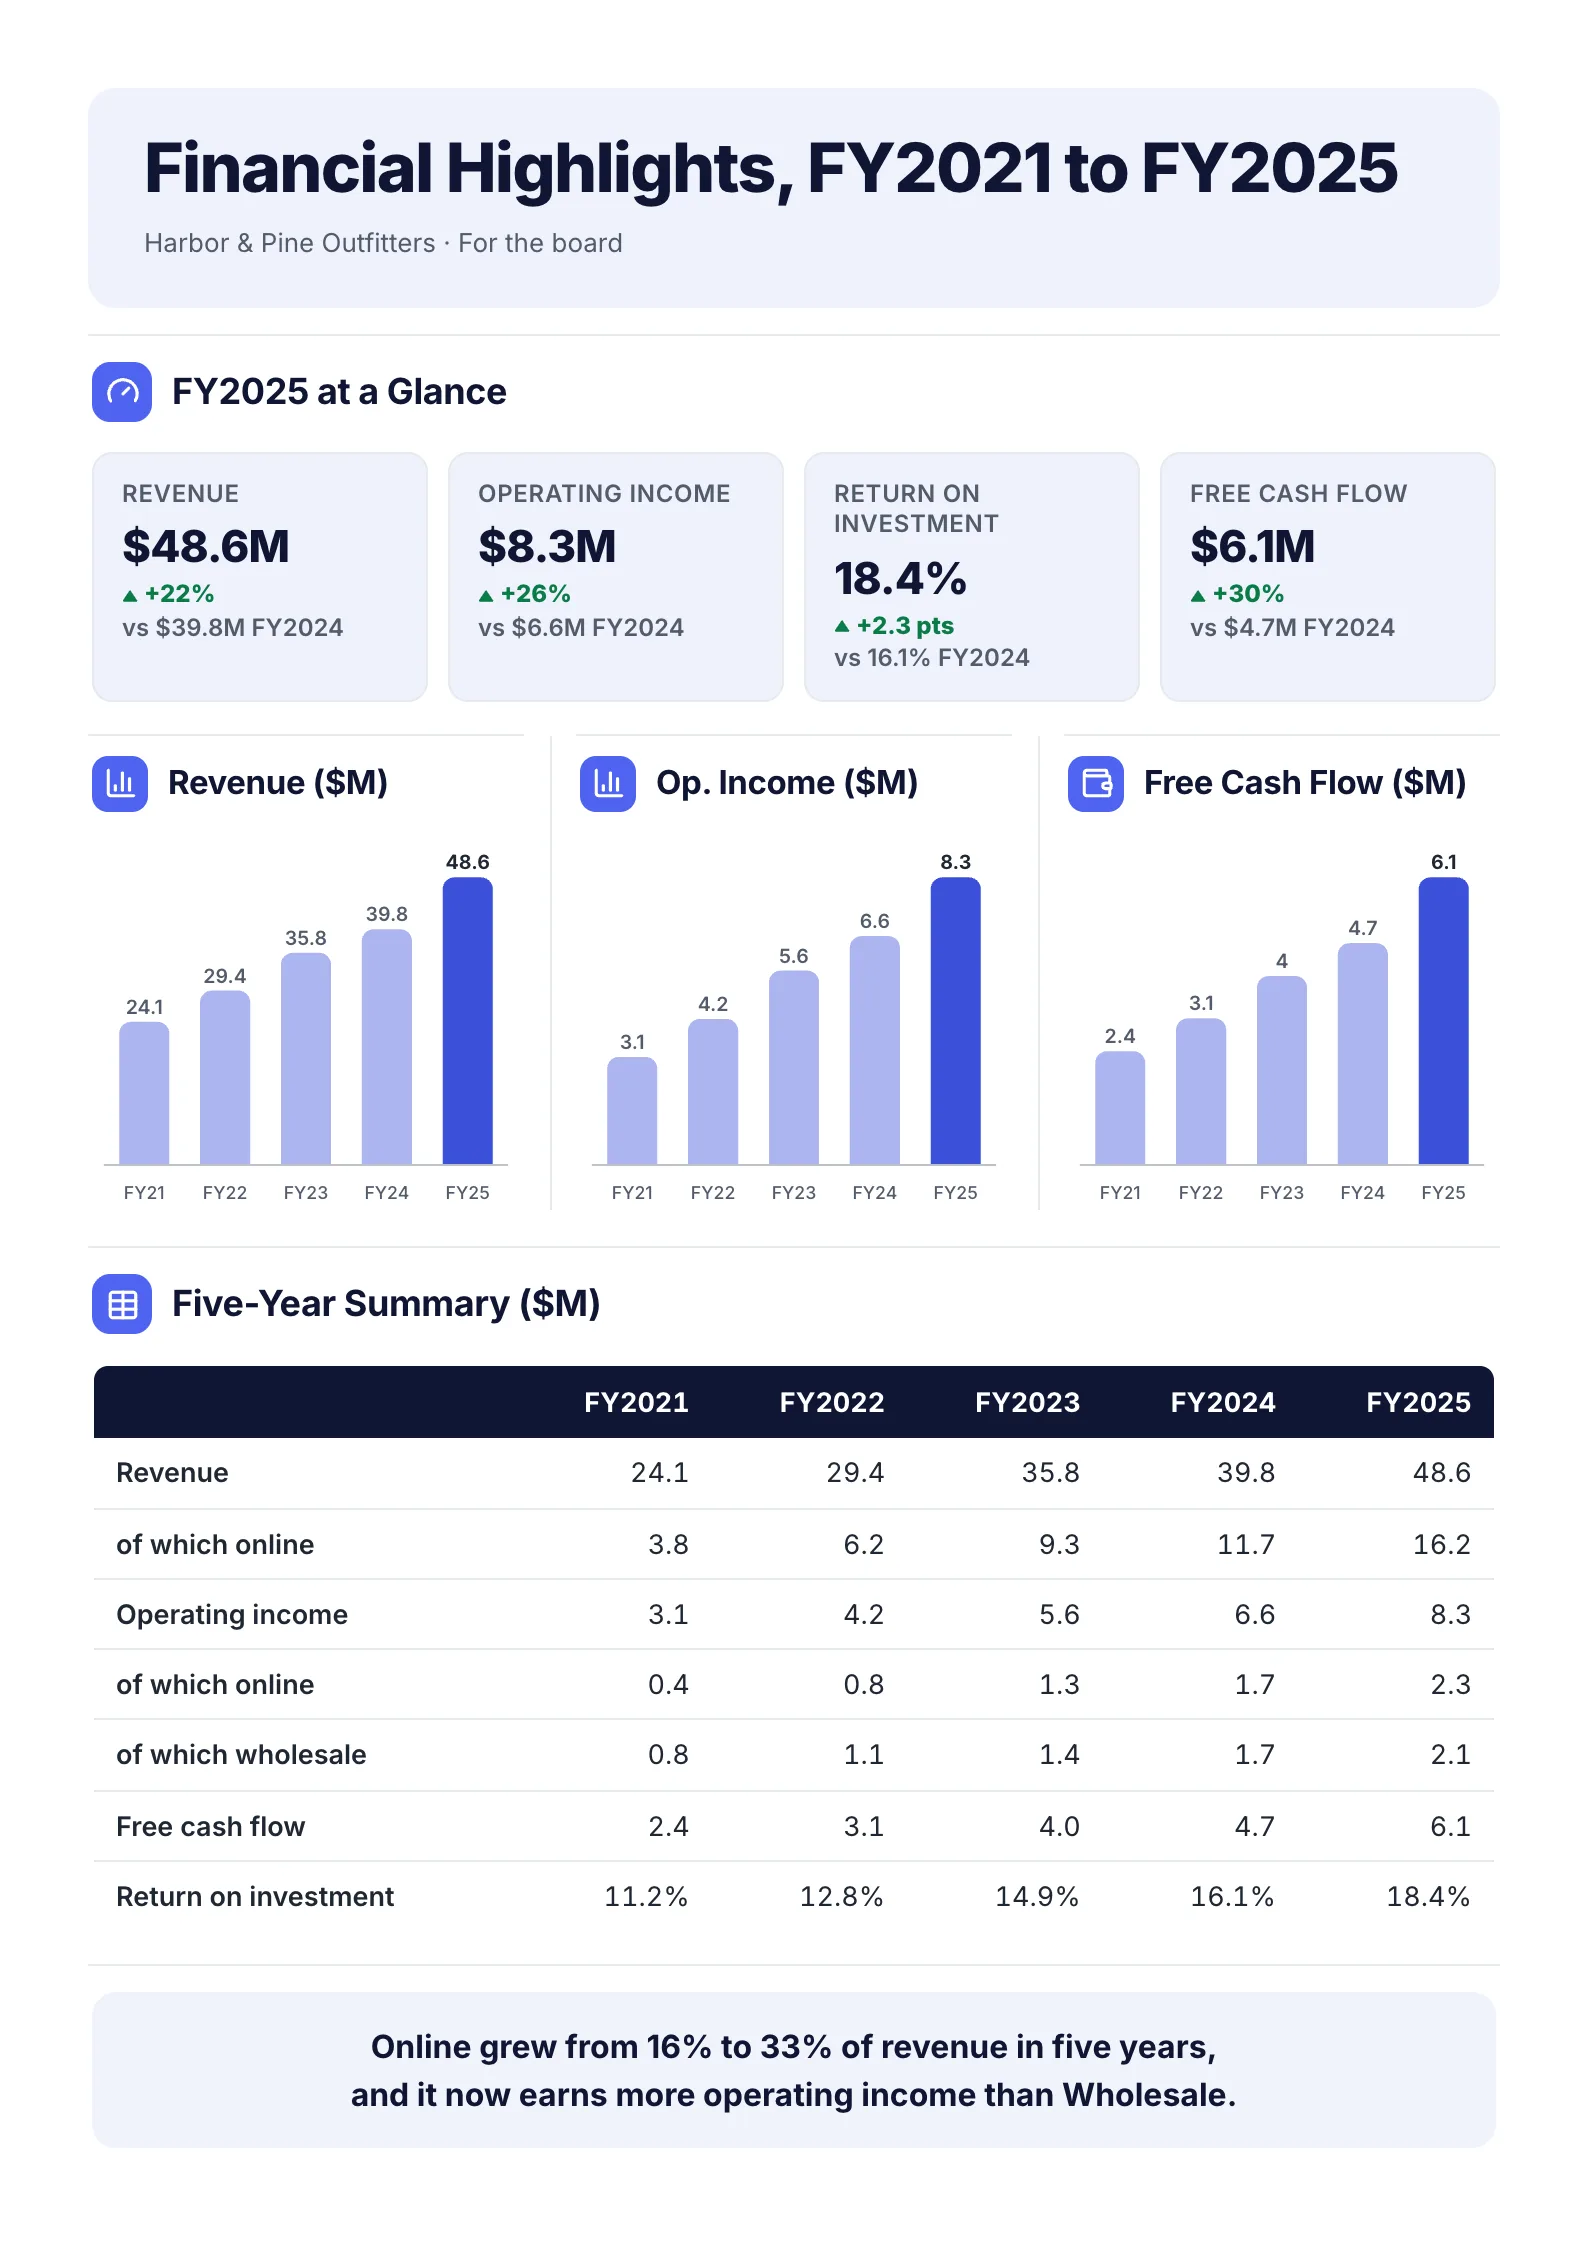 Edit this template
Sample figures for a sample company, laid out for a board meeting.
The company and figures are a sample. Here is what the summary says and how each number is worked out.
At a glance, FY2025 against FY2024
| Measure | FY2024 | FY2025 | Change |
|---|---|---|---|
| Revenue | $39.8M | $48.6M | +22% |
| Operating income | $6.6M | $8.3M | +26% |
| Free cash flow | $4.7M | $6.1M | +30% |
| Return on investment | 16.1% | 18.4% | +2.3 points |
The margins, worked out from the table
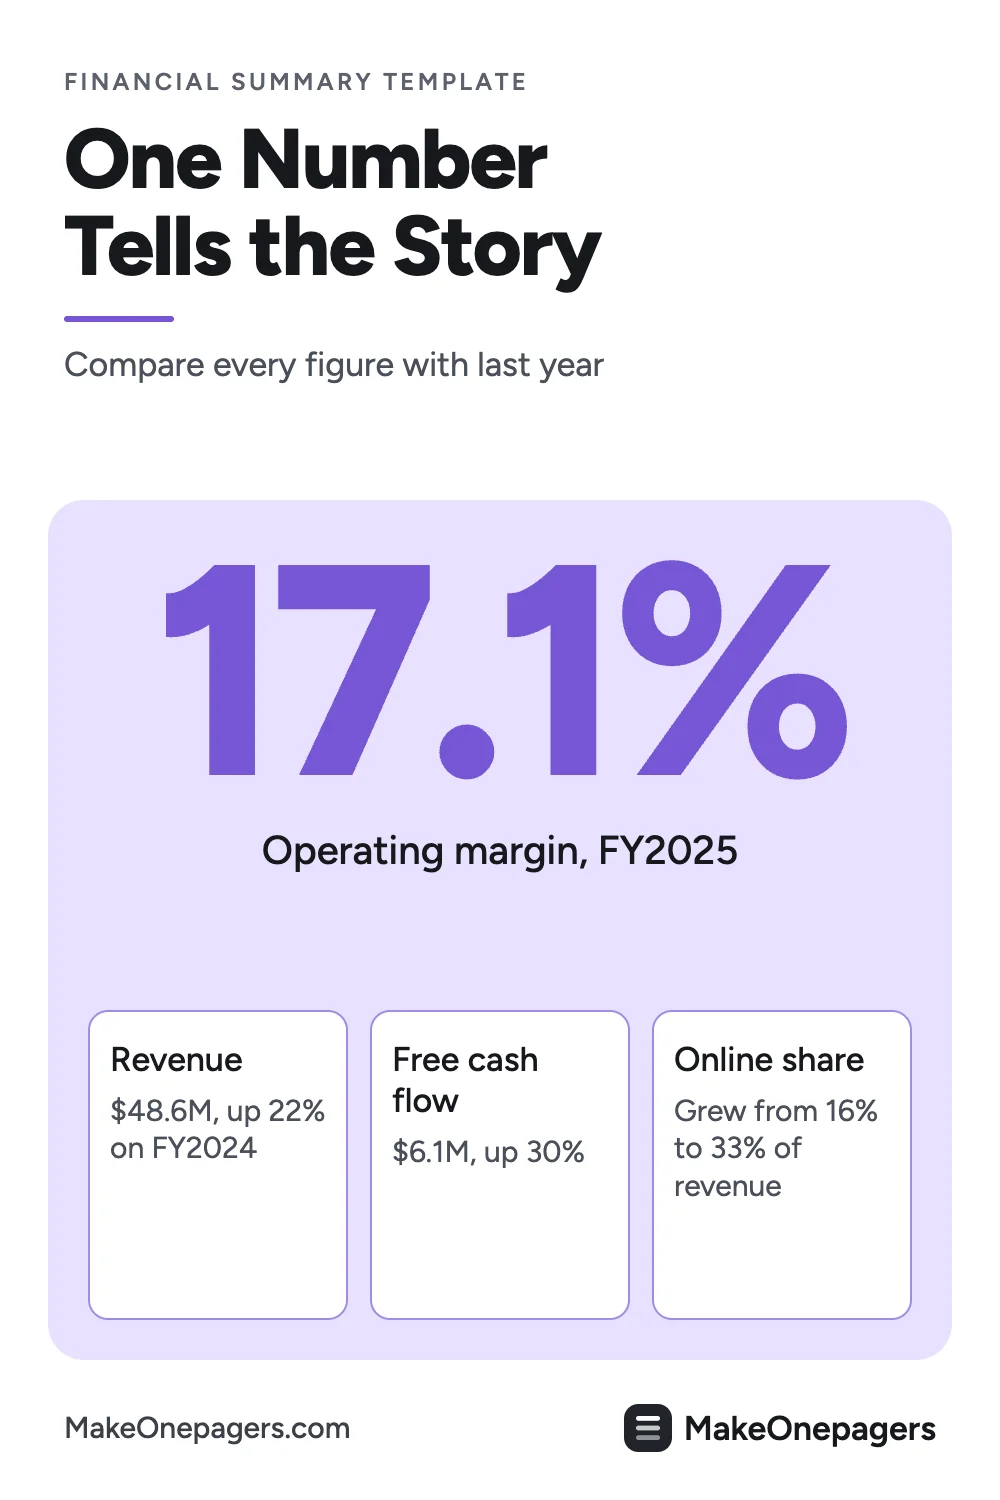
- Operating margin FY2025: $8.3M ÷ $48.6M = 17.1%
- Operating margin FY2024: $6.6M ÷ $39.8M = 16.6%
Operating income grew faster than revenue (26% against 22%), so the margin rose half a point. That is a better sign than growth alone, because it means each extra dollar of sales is bringing in a little more profit.
The split that explains it
- Online revenue FY2025: $16.2M ÷ $48.6M = 33% of the total
- Online revenue FY2021: $3.8M ÷ $24.1M = 16% of the total
The finding: "Online grew from 16% to 33% of revenue in five years, and it now earns more operating income than wholesale." In FY2025 online earned $2.3M of operating income against $2.1M for wholesale. One sentence, and the board knows where the growth came from and where the next investment should go.
Edit for free: financial highlights template.
5 financial summary examples
The worked example covers five years for a board. These five cover a month, a quarter and a year, for an owner, a board, investors, donors and a buyer. Each puts the comparison beside every headline number.
1. Small business financial summary
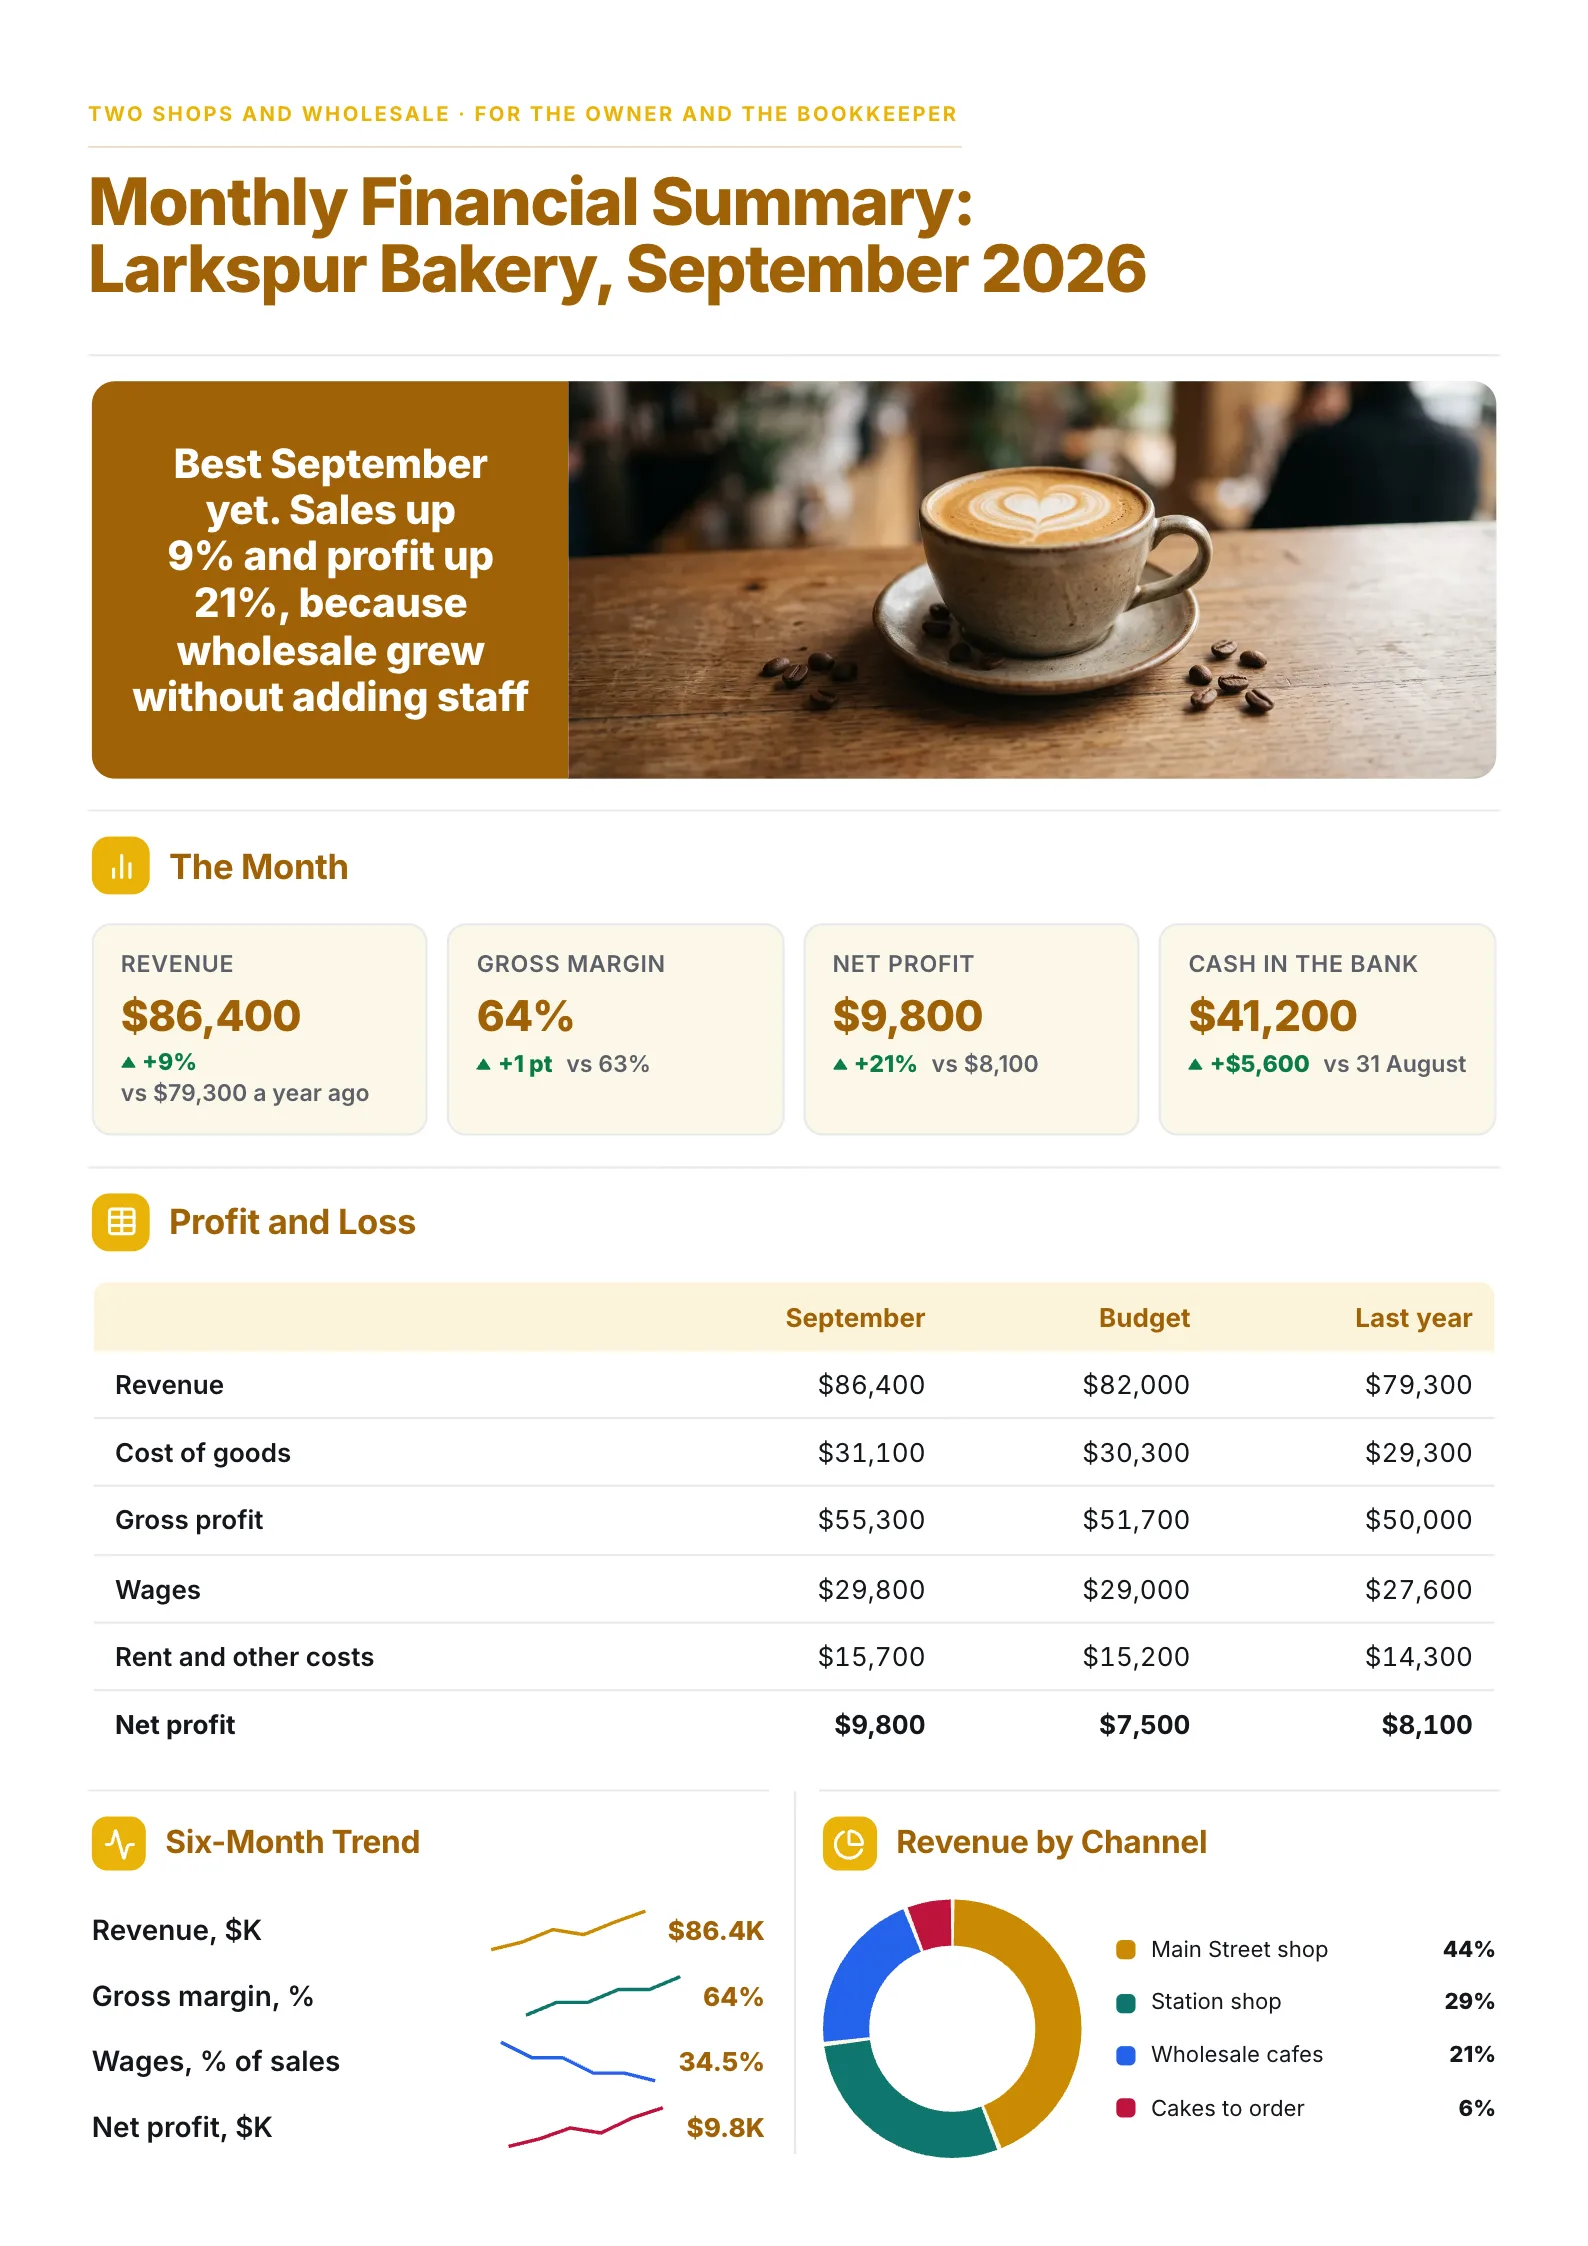 Edit this template
A two-shop bakery's month, with this September set against the budget and against last September.
What to copy:
- The month in one line, with the reason. "Sales up 9% and profit up 21%, because wholesale grew without adding staff."
- Three columns in the profit and loss. September, budget and last year, side by side.
- Cash beside profit. $41,200 in the bank, up $5,600 on 31 August.
Edit for free: small business monthly financial summary template.
2. Nonprofit financial summary
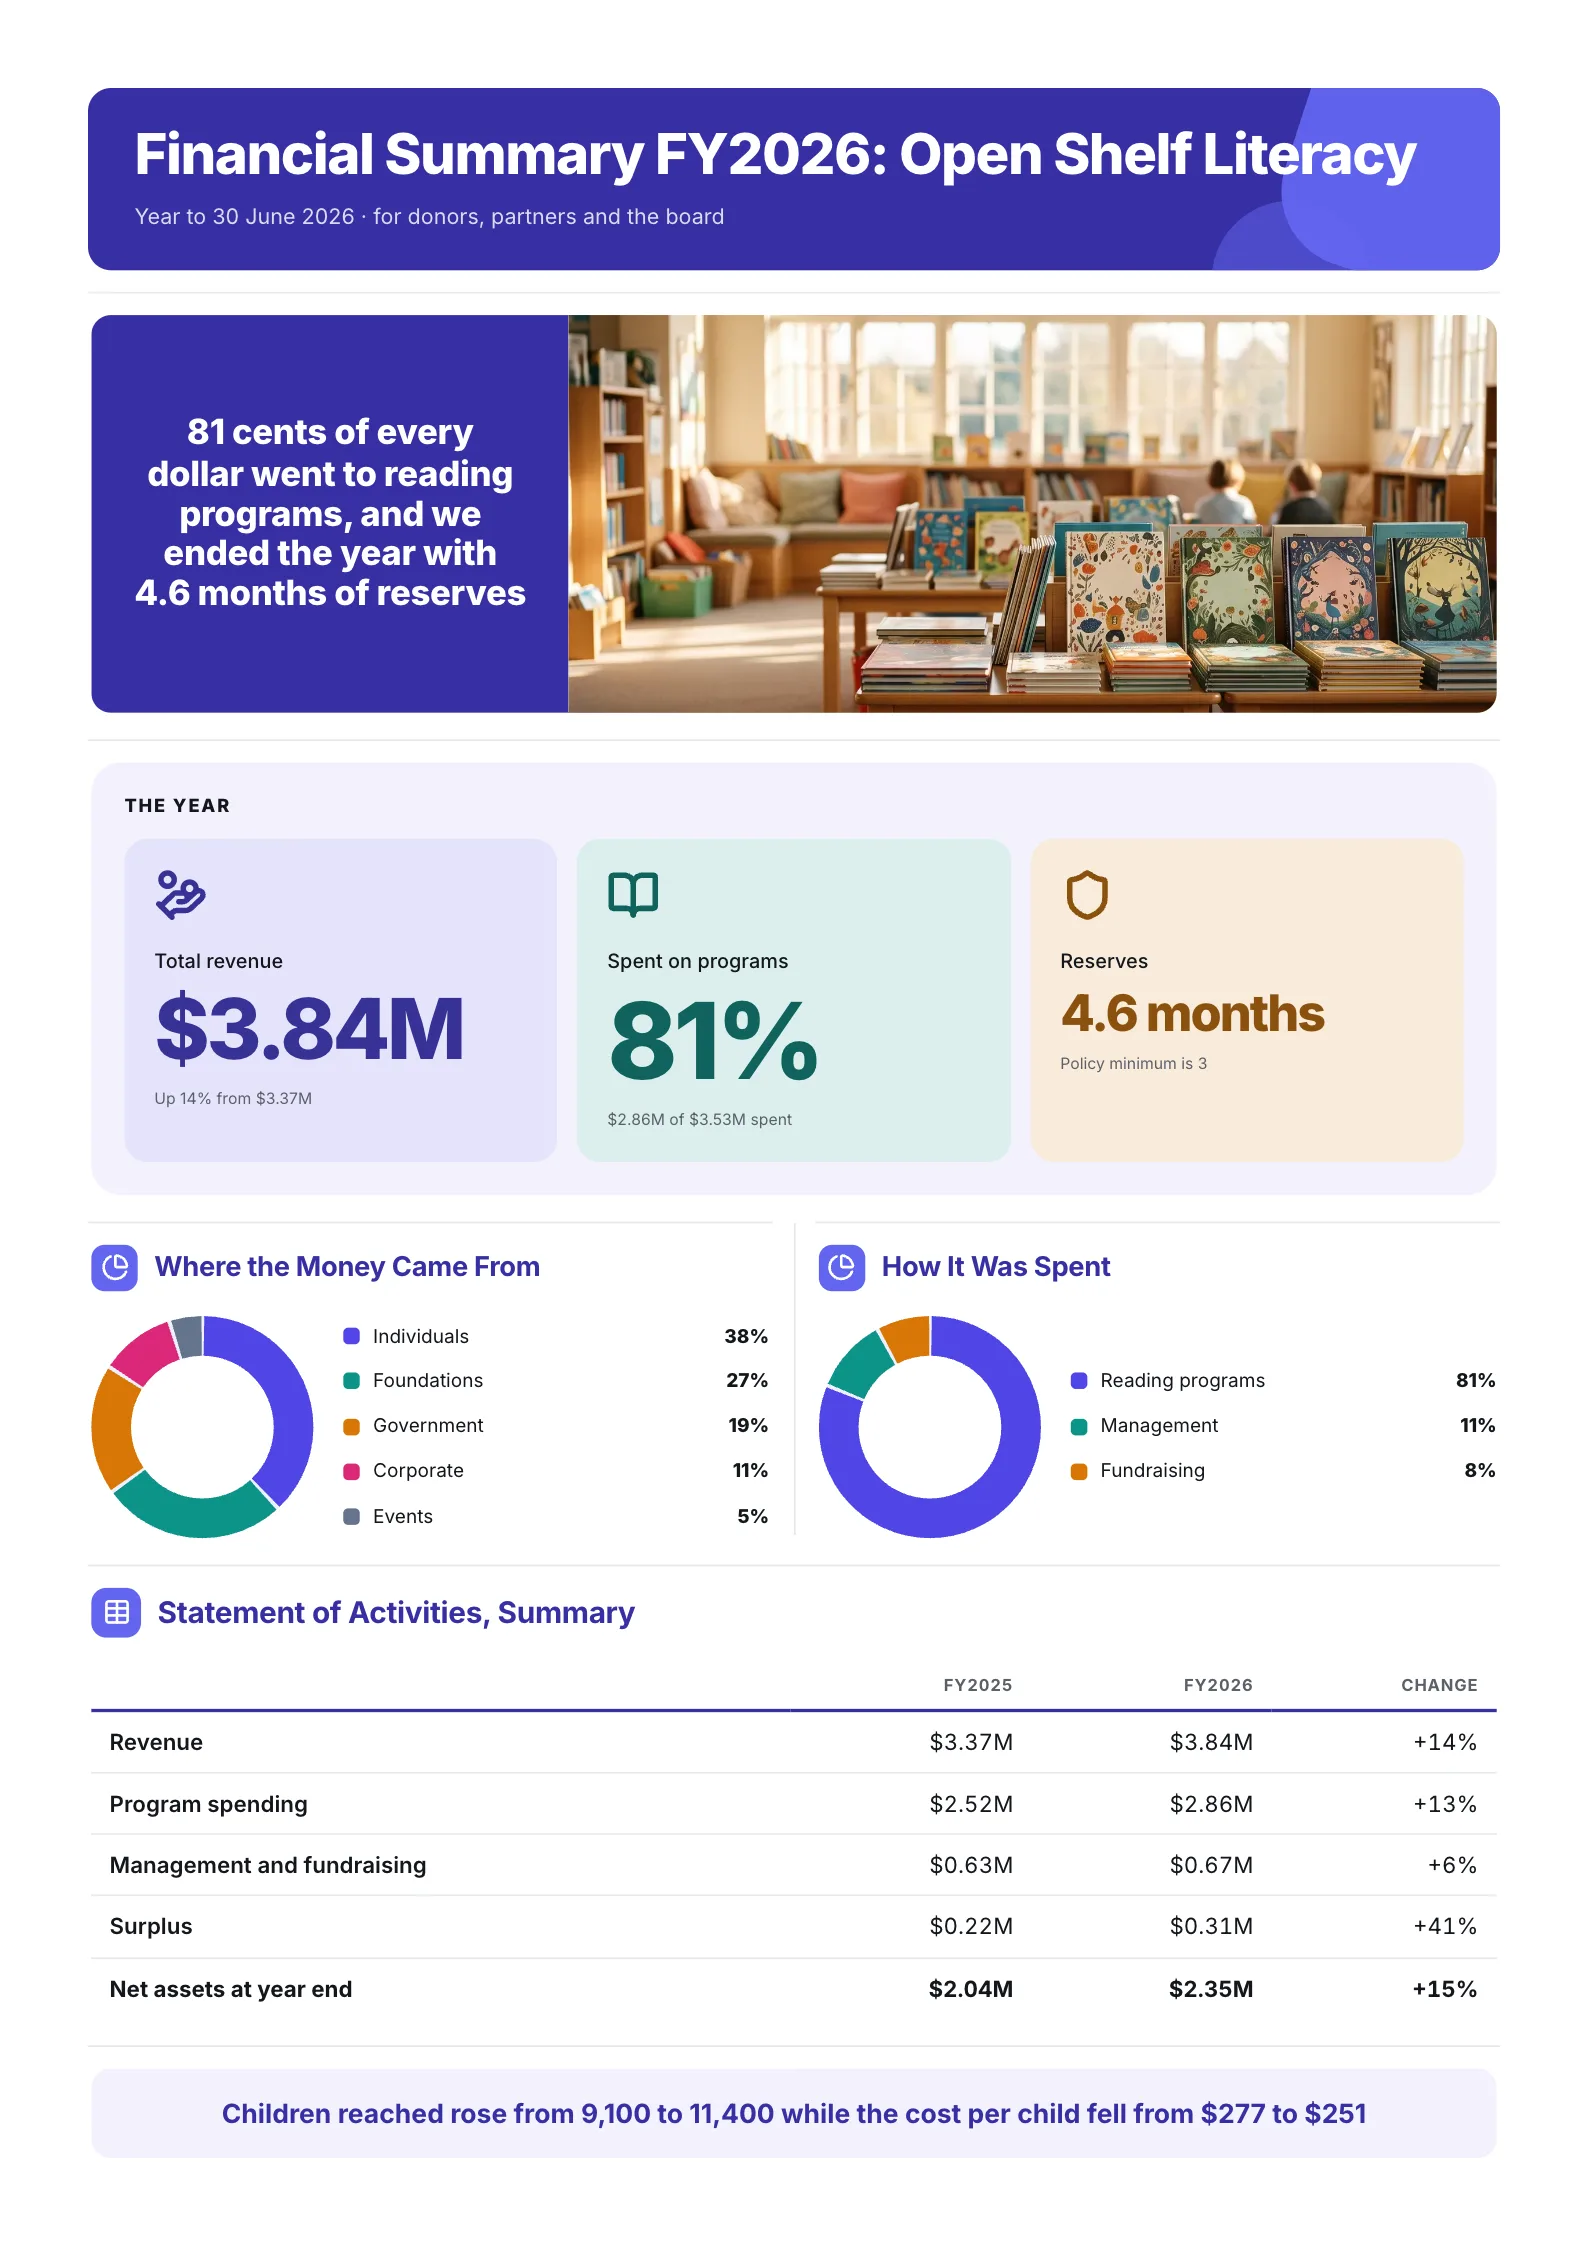 Edit this template
A literacy charity's year, written for the donors who funded it.
What to copy:
- The share that reached the mission. "81 cents of every dollar went to reading programs."
- Reserves against the policy. 4.6 months, against a policy minimum of 3.
- Where the money came from. Individuals, foundations, government, corporate and events, on one chart.
Edit for free: nonprofit annual financial summary template.
3. Quarterly board financial summary
 Edit this template
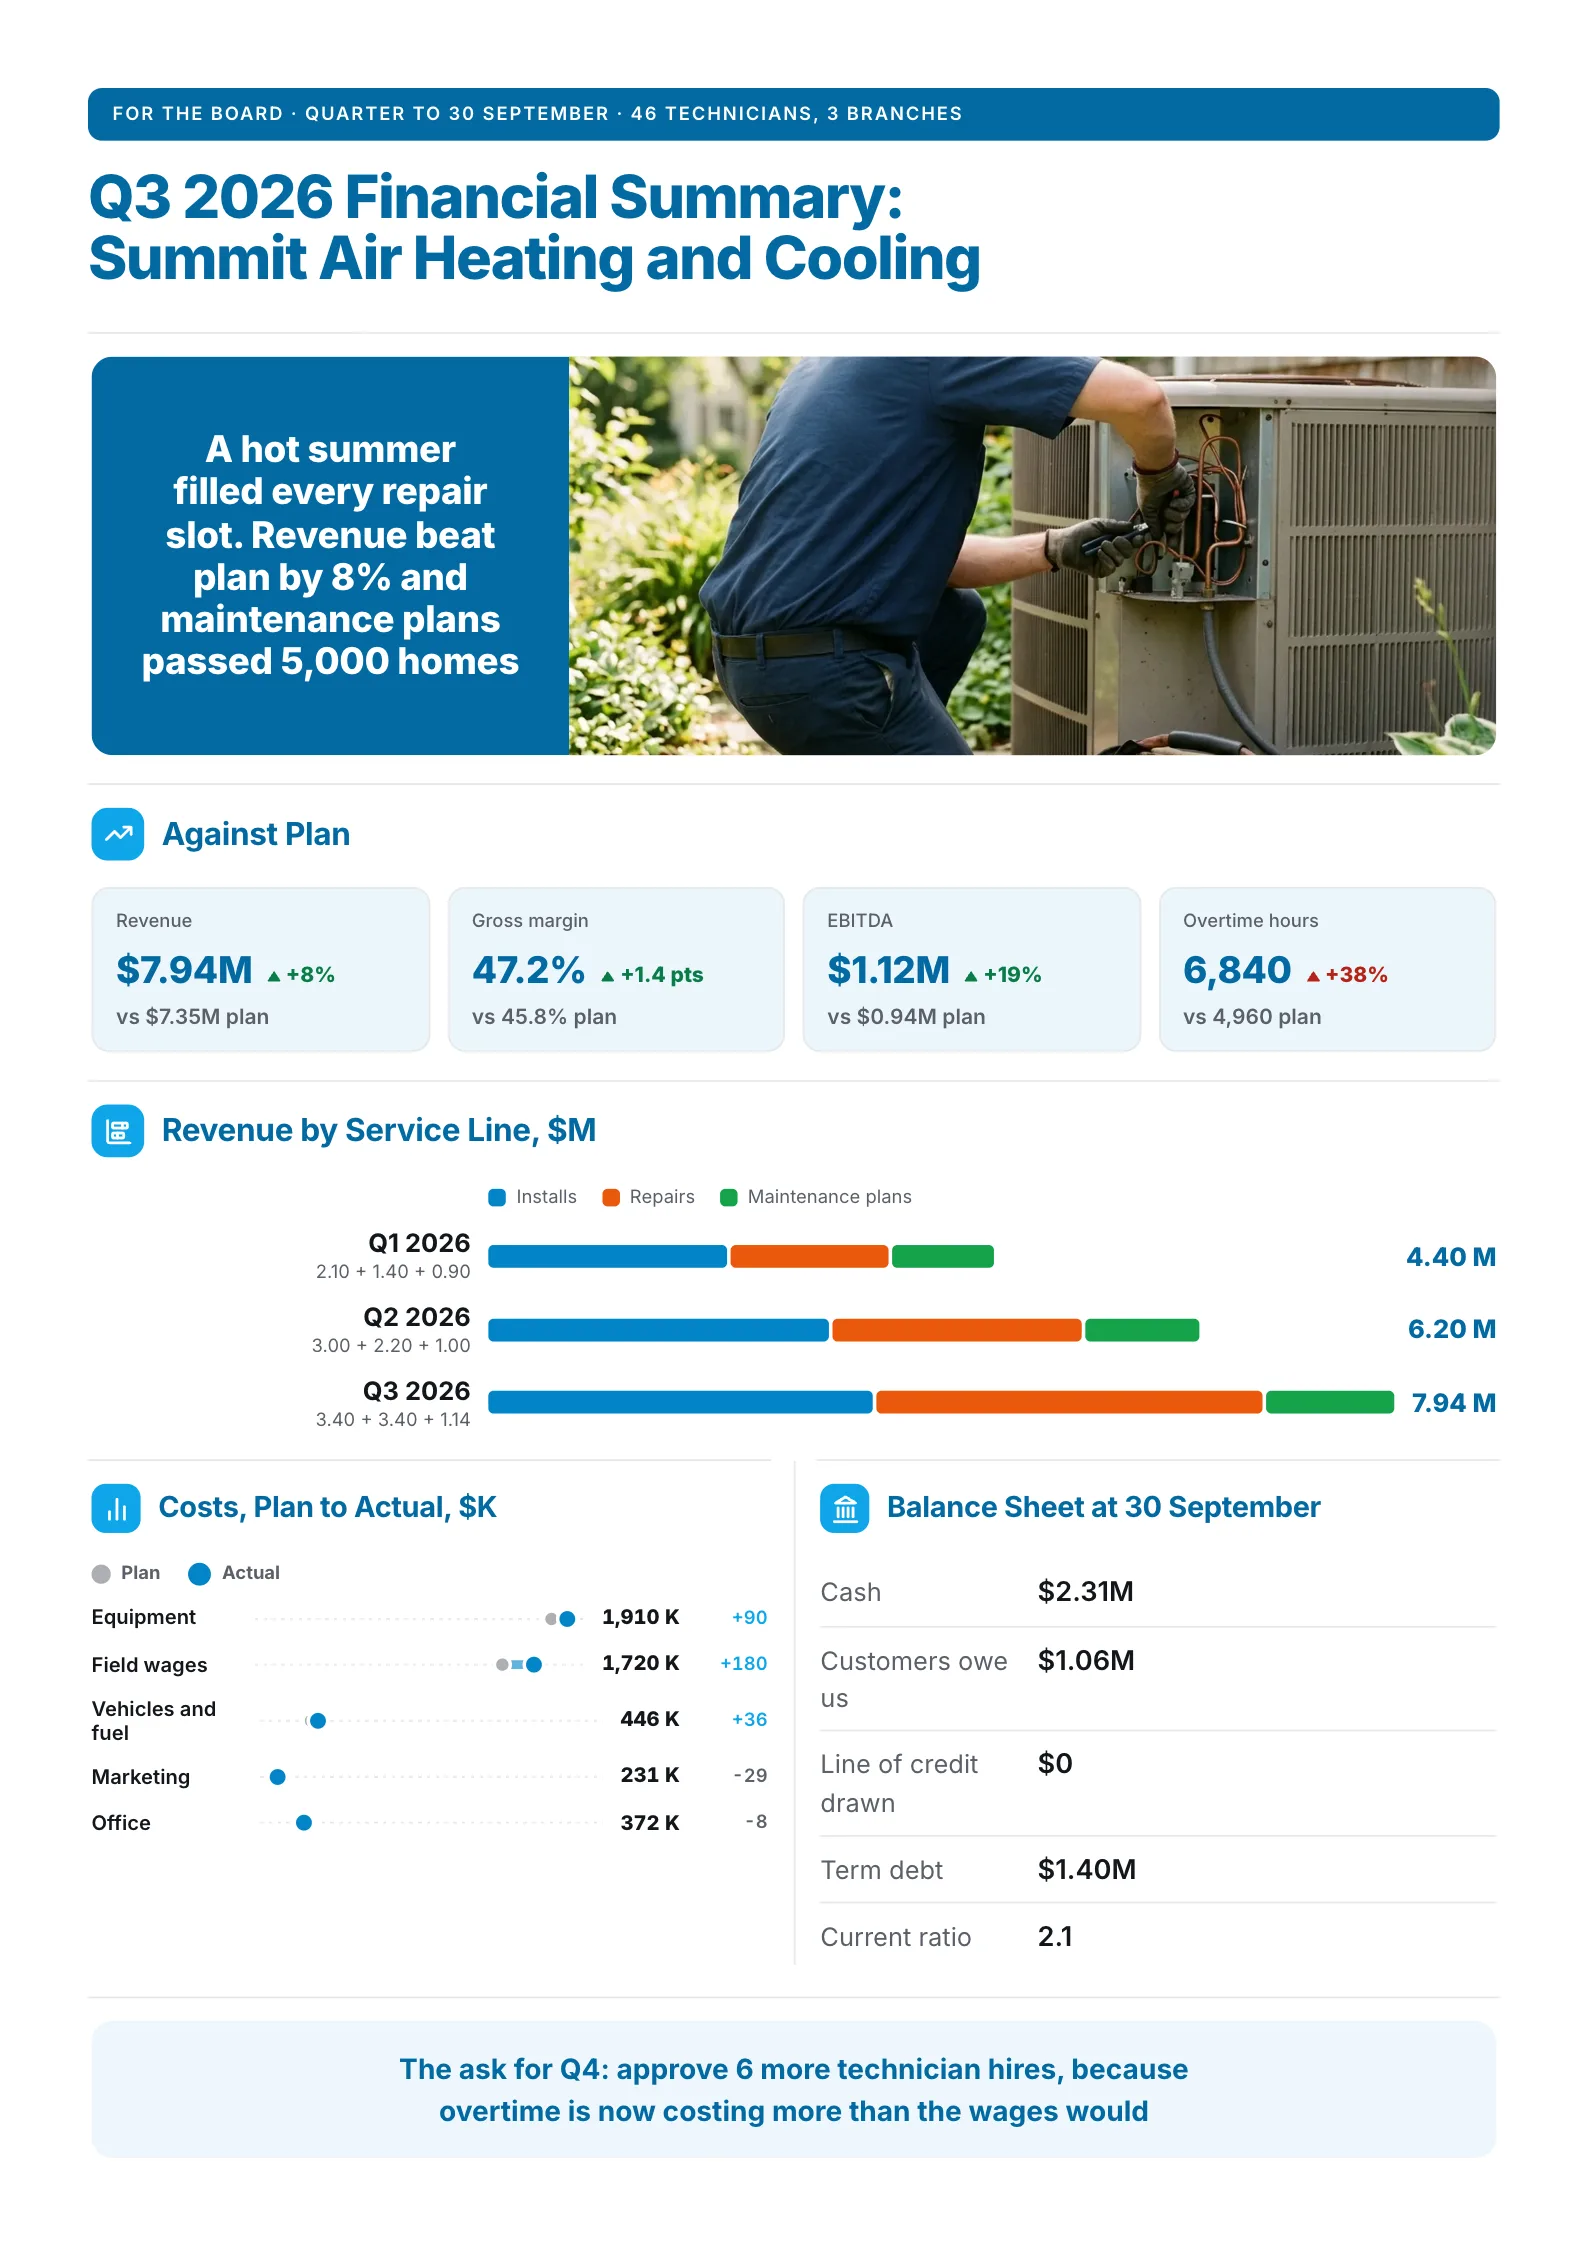
A heating and cooling company reports its quarter against plan, not just against last year.
What to copy:
- Every number against plan. Revenue $7.94M, 8% above the $7.35M plan.
- The cost of a good quarter, shown. Overtime hours of 6,840, 38% above plan.
- Revenue by service line. Installs, repairs and maintenance plans over three quarters.
Edit for free: quarterly board financial summary template.
4. SaaS investor financial summary
 Edit this template
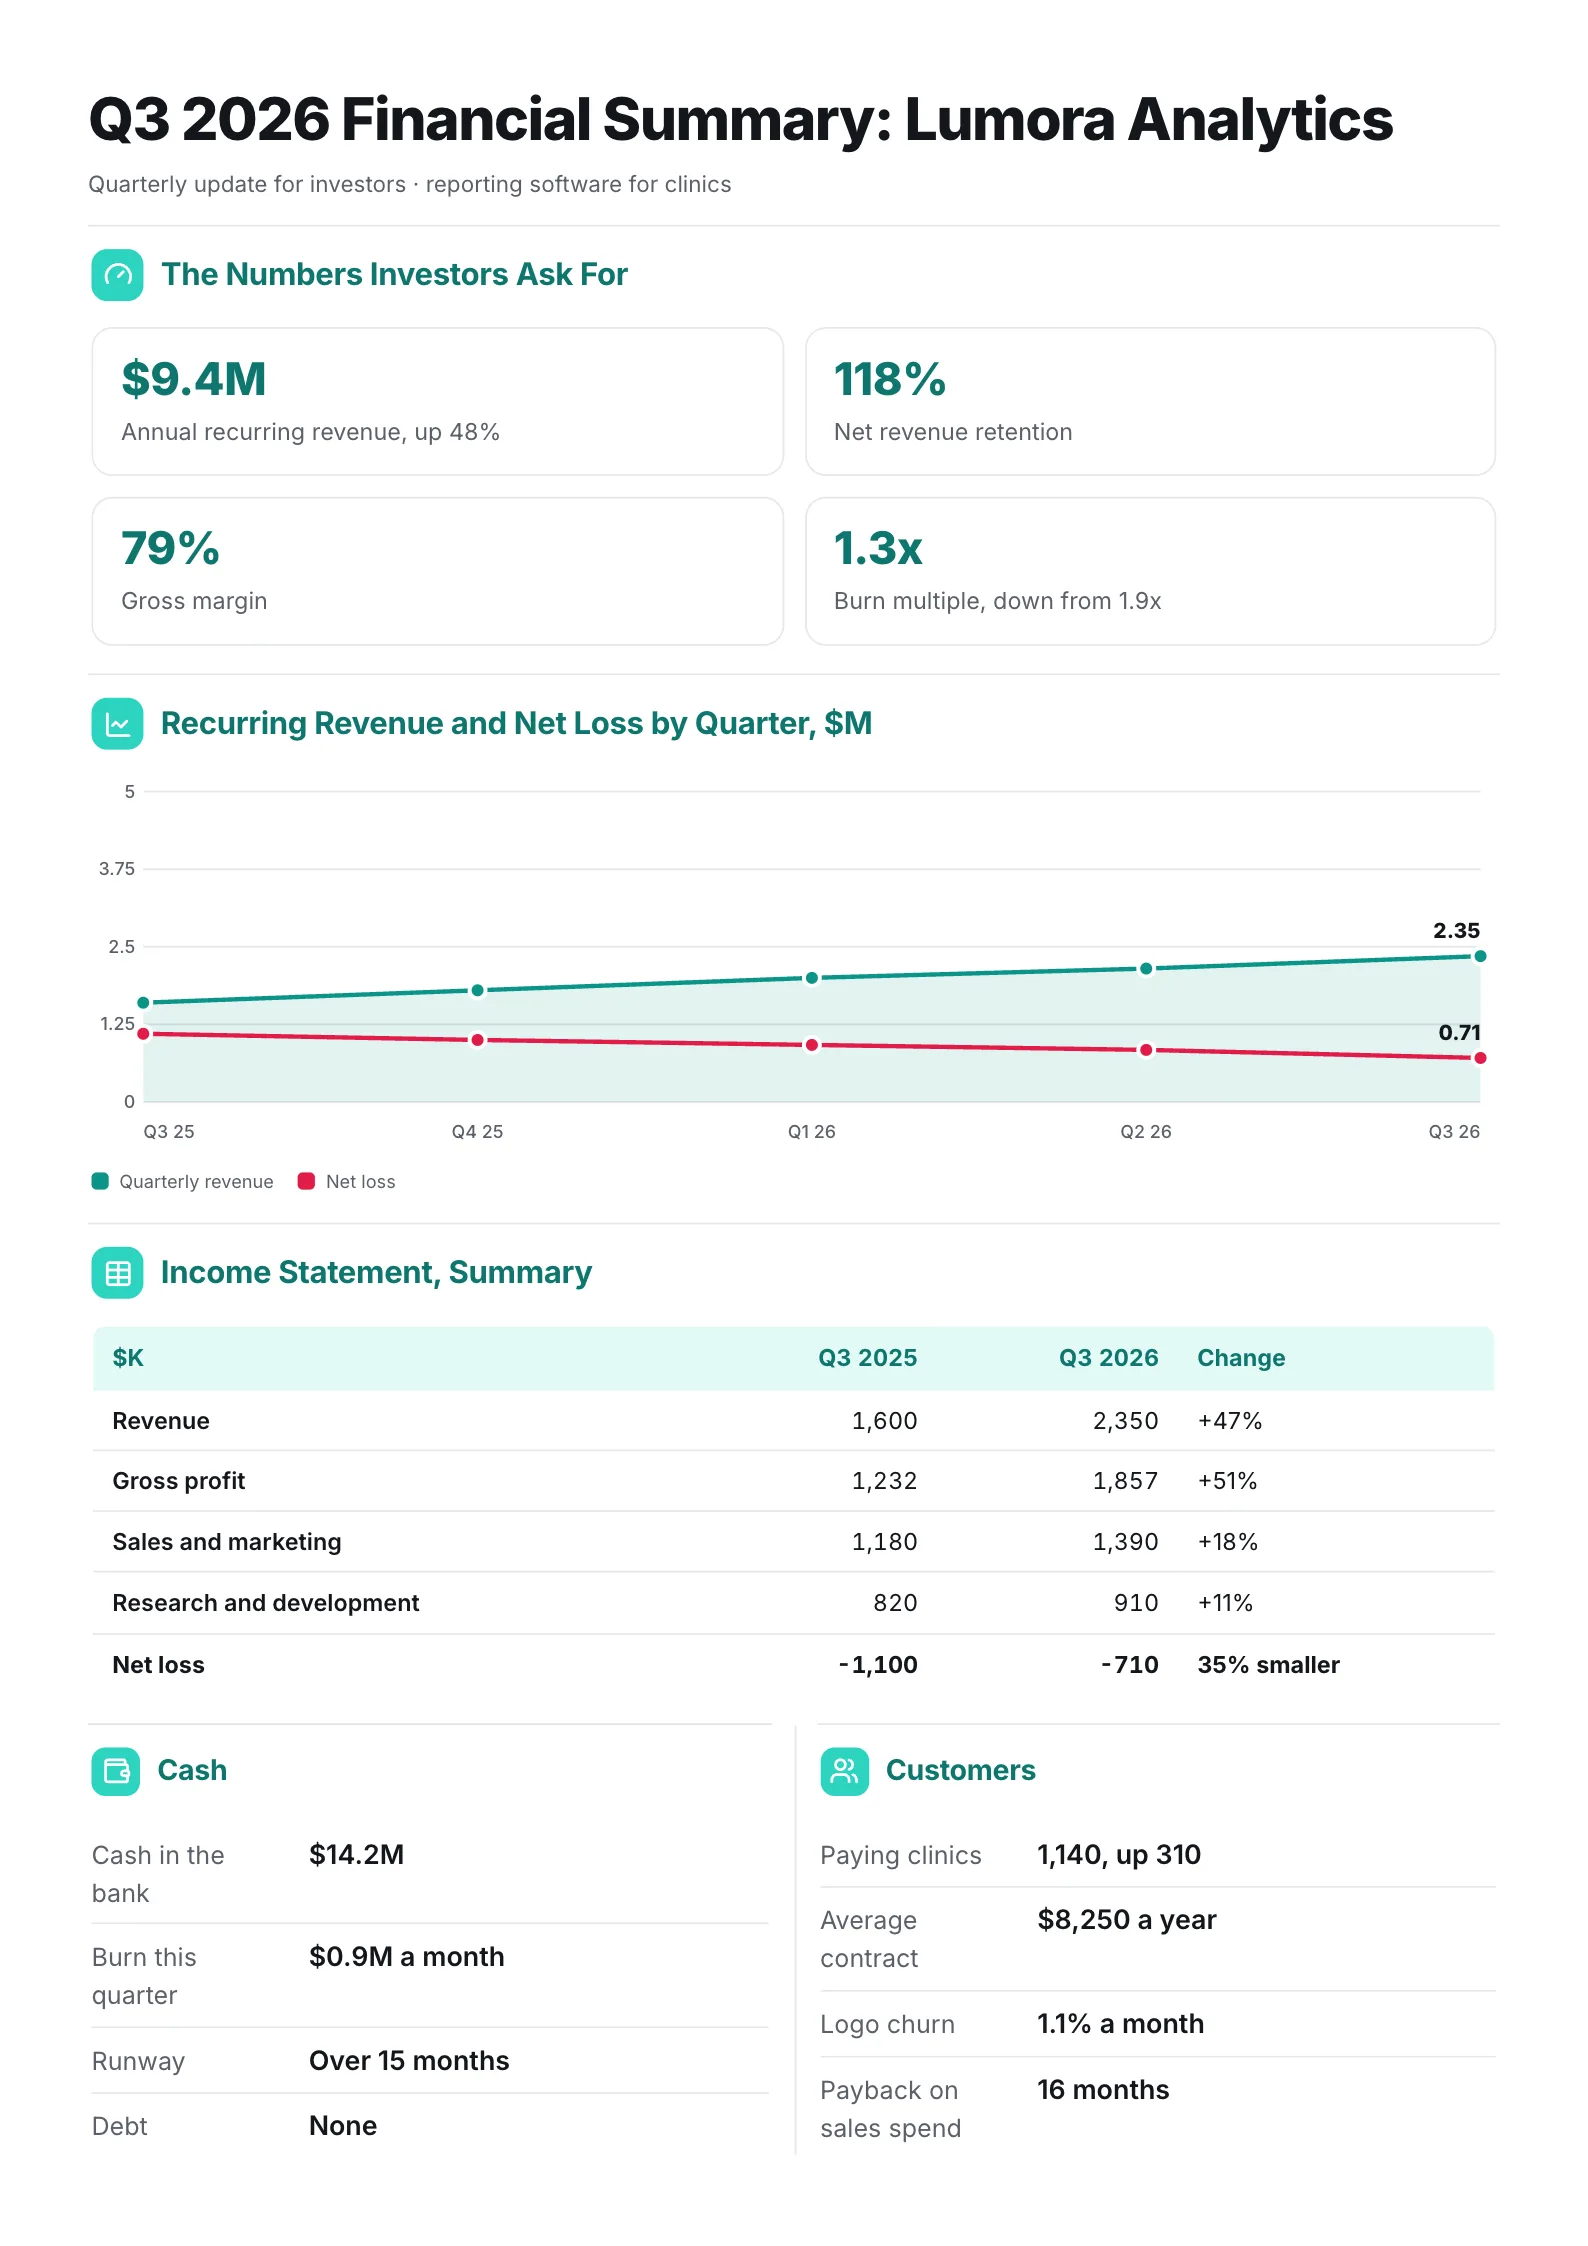
A software company gives investors the numbers they ask for first, before the income statement.
What to copy:
- The investor's four numbers. Recurring revenue, net revenue retention, gross margin and burn multiple.
- The loss shrinking beside growth. Revenue up 47%, net loss 35% smaller.
- Runway stated plainly. $14.2M in the bank, over 15 months of runway, no debt.
Edit for free: SaaS investor financial summary template.
5. Business for sale financial summary
 Edit this template
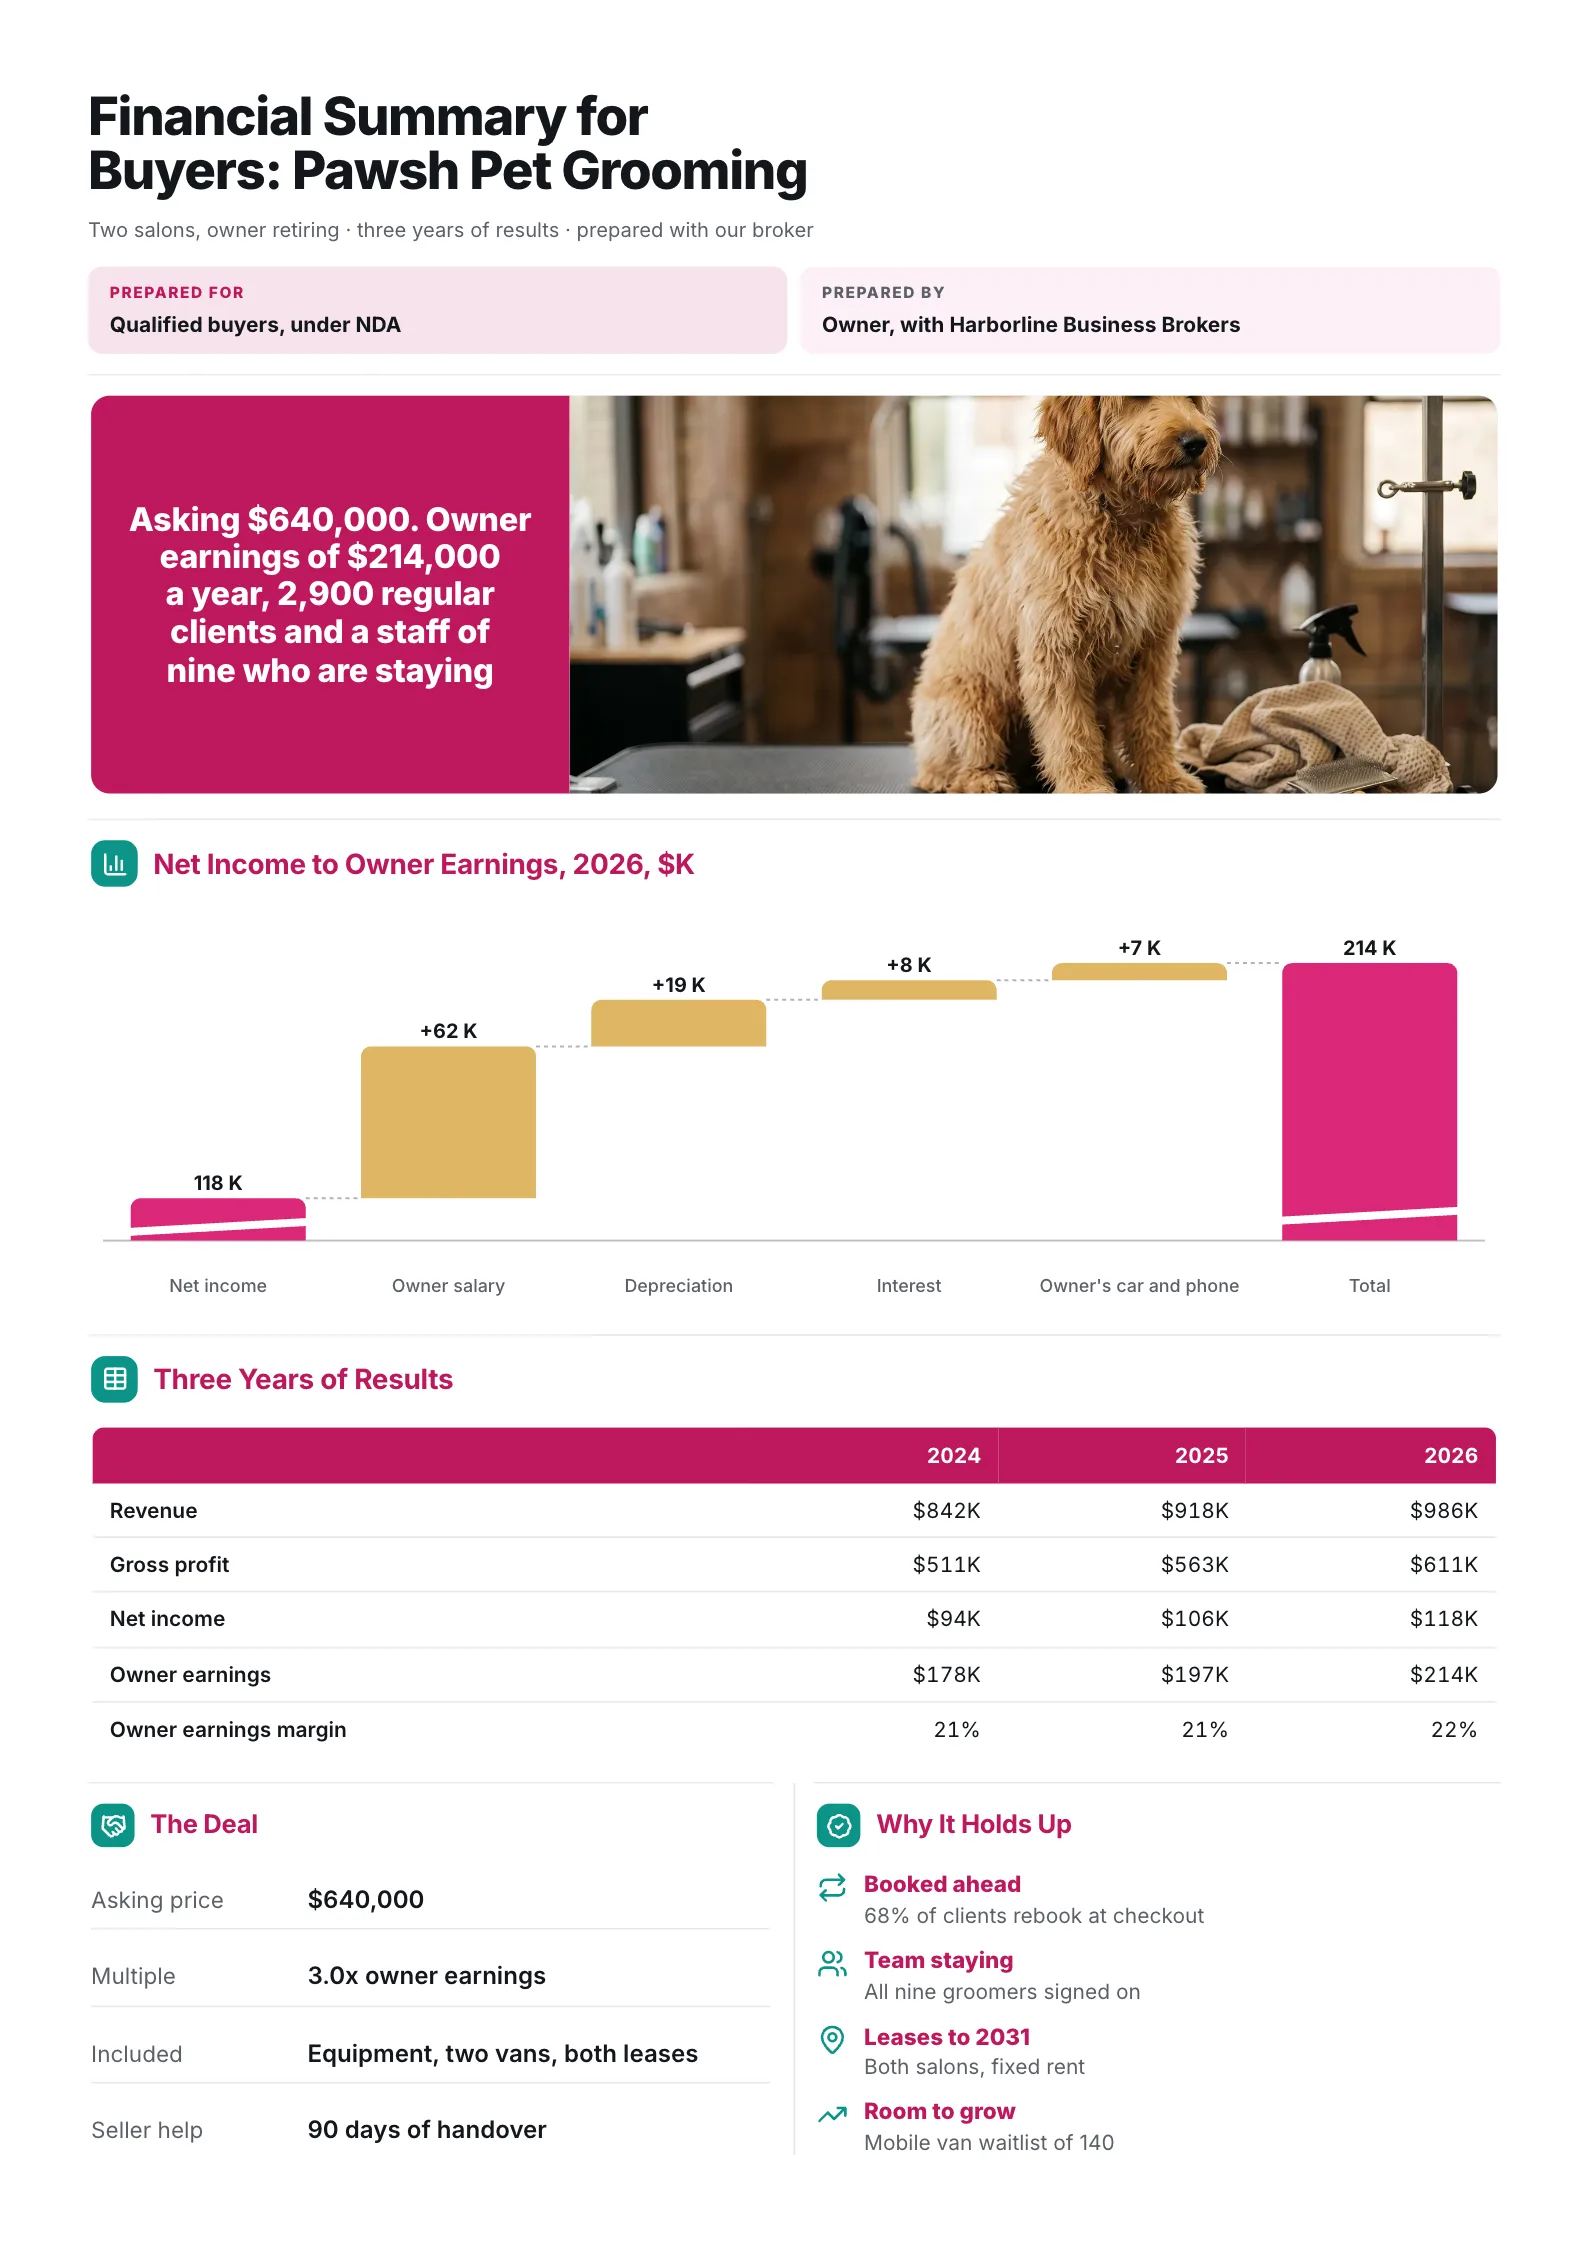
A retiring owner shows buyers what the business really earns for whoever runs it.
What to copy:
- The price and what it buys, first. Asking $640,000 for $214,000 a year of owner earnings.
- A bridge from net income to owner earnings. Owner salary, depreciation, interest and the owner's car and phone added back.
- The multiple, worked out. 3.0x owner earnings.
Edit for free: business for sale financial summary template.
Financial summary vs financial statements vs financial report
| Financial statements | Financial report | Financial summary | |
|---|---|---|---|
| What it is | Income statement, balance sheet, cash flow statement | The statements plus notes and commentary | The key numbers and what they mean |
| Length | Several pages | Many pages | One page |
| Written for | Accountants, auditors, regulators | Owners, lenders, investors | Anyone who decides or approves |
| Answers | What exactly happened | What happened and why | Are we healthy, and what changed |
How to write a financial summary in 6 steps
- Start from the closed statements for the period, and the same statements for earlier periods.
- Choose five or six headline numbers that match what your readers decide.
- Put last period beside each one, with the change as a percentage or in points.
- Work out two or three ratios that explain the change.
- Add a trend over three to five periods and any split that matters.
- Write one finding and, if a decision is needed, the decision.
If your accounts or annual report already exist as a PDF, the free AI One-Pager generator reads a PDF, Word or PowerPoint file and gives it back as a designed One-Pager, with the figures pulled from your file. Check every number against the statements before you share it.
Financial summary mistakes
- Numbers with nothing beside them. "$8.3M operating income" invites "is that good?" Add last year.
- Growth without margin. Revenue up 22% means less if costs rose 30%.
- Too many ratios. Choose the two or three your readers use to decide.
- Mixed periods. A fiscal year in one chart and a calendar year in the next confuses everyone.
- No source line. Say whether the figures are audited, and when they were closed.
- No finding. The summary should say what the numbers mean, not leave the reader to work it out.
Make your financial summary
Open the free financial summary template and put in your own numbers, or drop your accounts into the free AI One-Pager generator and get a finished financial summary back.
Frequently asked questions
What should a financial summary include?
Revenue, profit at one or two levels, free cash flow, a return measure, each with last period beside it, plus a trend over several periods, two or three ratios such as operating margin, and a one-sentence finding.
How long should a financial summary be?
One page. The full statements and notes can follow it for readers who want the detail.
What is the difference between a financial summary and an executive summary?
An executive summary covers a whole report or plan, including strategy, operations and risks. A financial summary covers only the numbers. A business plan often has both.
Is there a financial summary template in Excel?
Spreadsheet tools are good for building the numbers and ratios. Present the result on a one-page summary for the people who read and approve it.